Fig. 1.
Download original image
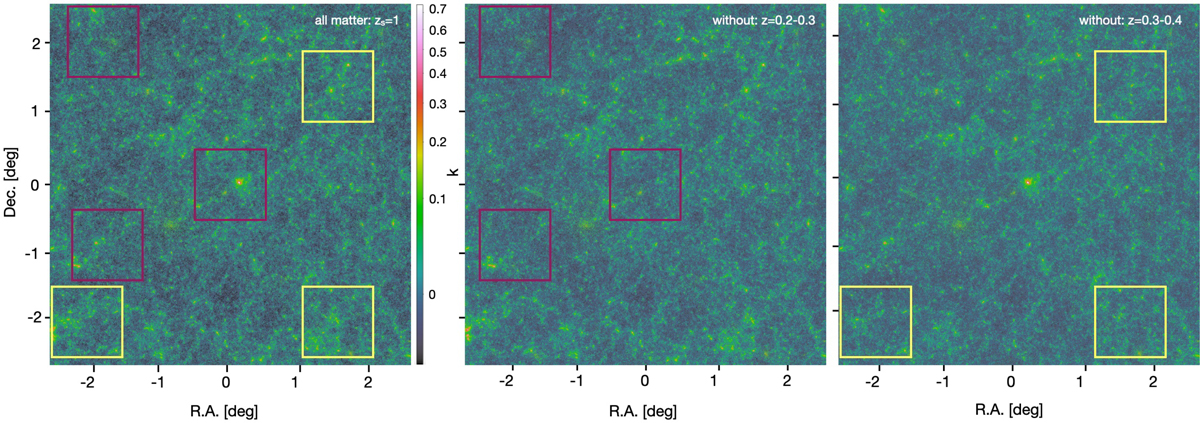
Convergence map (5 deg on a side) for fixed source redshift zs = 1. In the left panel, we consider all the matter present along the line of sight from z = 0 to z = 1, while in the central and right panels, we remove the matter located in a redshift slice as indicated in the legend. The red and yellow squares highlight some particular high-density regions that disappear in the central and right panels when discarding the matter present in the considered redshift slices.
Current usage metrics show cumulative count of Article Views (full-text article views including HTML views, PDF and ePub downloads, according to the available data) and Abstracts Views on Vision4Press platform.
Data correspond to usage on the plateform after 2015. The current usage metrics is available 48-96 hours after online publication and is updated daily on week days.
Initial download of the metrics may take a while.