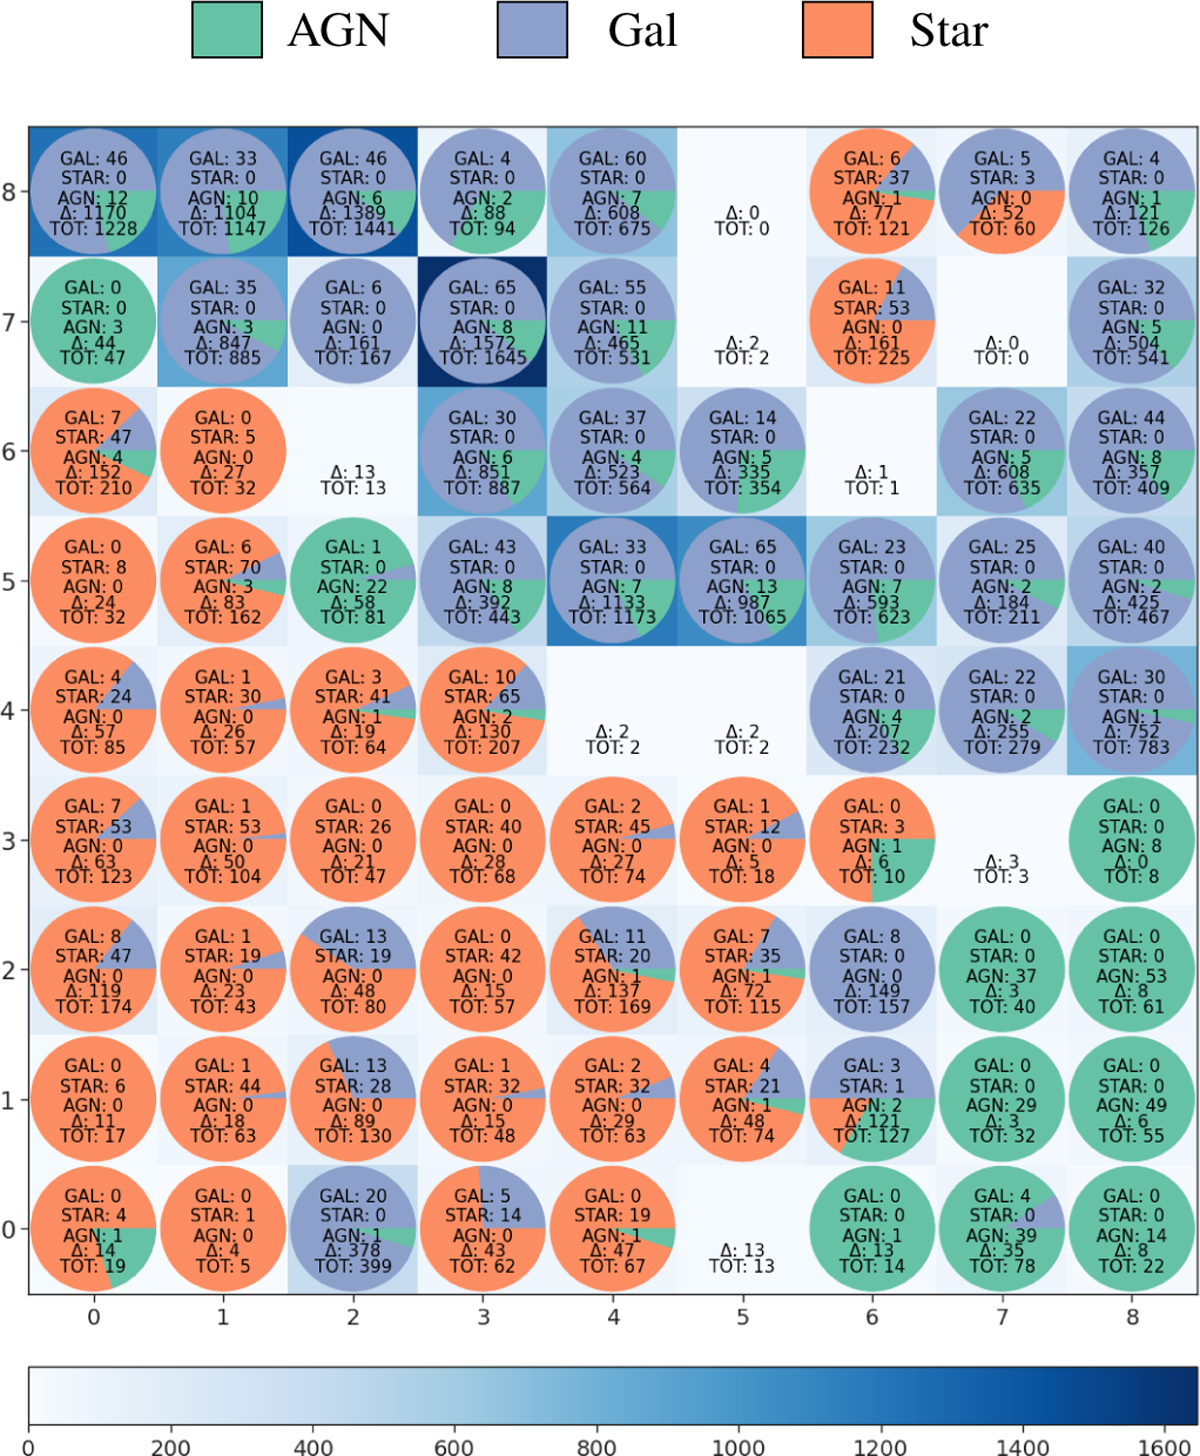
Fig. 5
Download original image
Activation map of the Main Experiment. A pie chart representing the distribution of labels has been overlaid on each cell of the map. For each cell, it has been indicated: the number of galaxies (GAL), the number of stars (STAR), and the number of AGNs, from the LS; the number of unlabeled objects (Δ); the total number of labeled and unlabeled objects (TOT). The background color intensity reflects the number of objects falling in the cell.
Current usage metrics show cumulative count of Article Views (full-text article views including HTML views, PDF and ePub downloads, according to the available data) and Abstracts Views on Vision4Press platform.
Data correspond to usage on the plateform after 2015. The current usage metrics is available 48-96 hours after online publication and is updated daily on week days.
Initial download of the metrics may take a while.