Fig. 9
Download original image
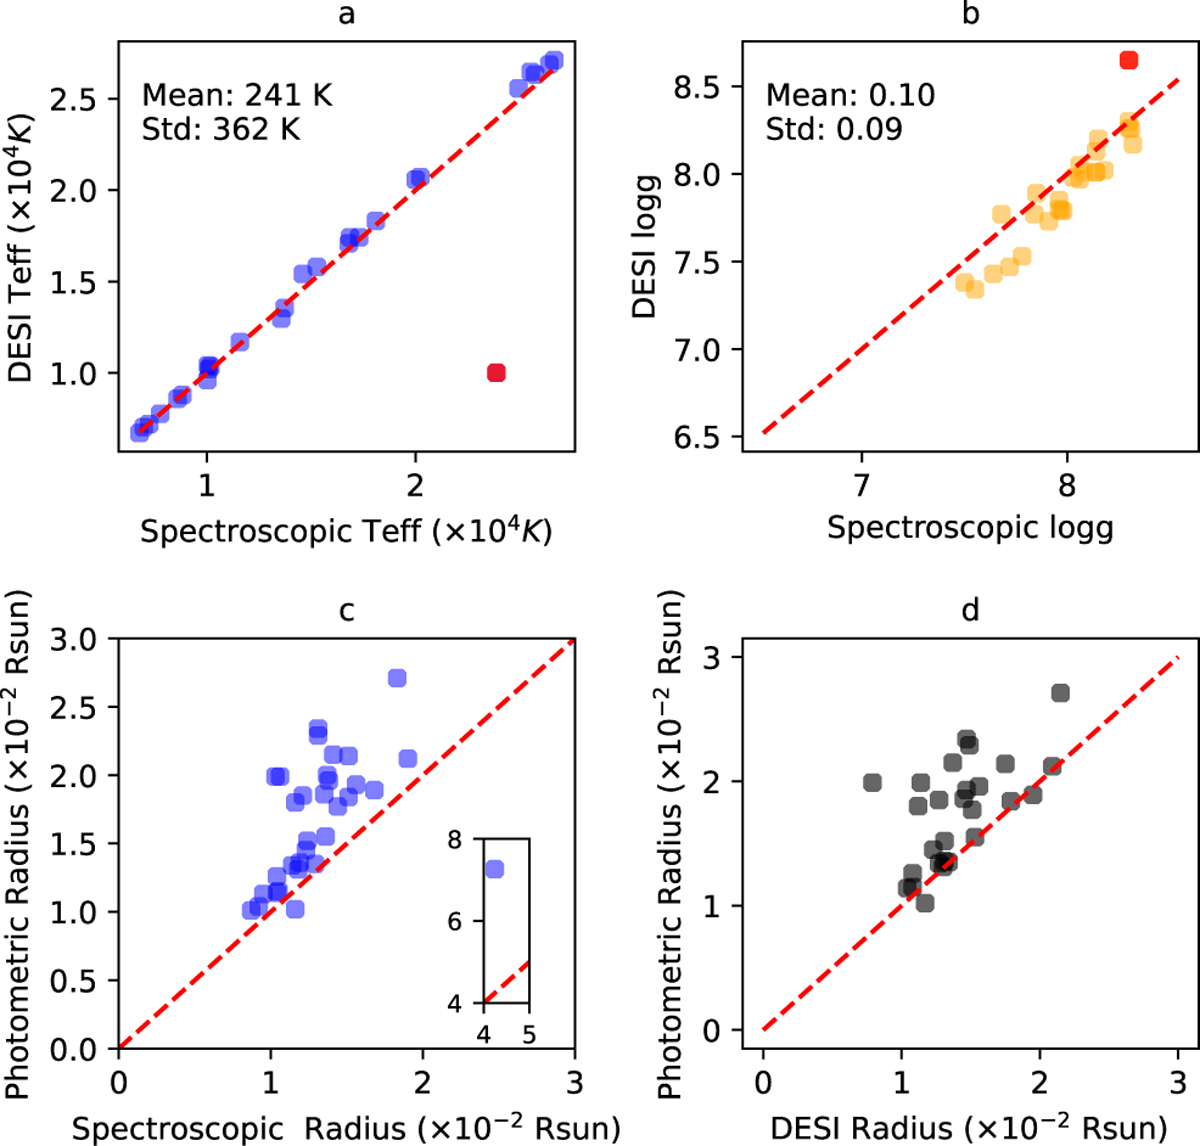
a and b: comparison plots between our spectroscopic parameters and those from Manser et al. (2024). The red point represents the outlier in Figure 8. Temporarily ignoring this outlier, our calculated Teff and log g differ from their results by a mean difference of 241 K and 0.1, with a standard deviation of 362 K and 0.09, respectively, indicating a certain degree of consistency. Notably, six sources are not included in their catalog. c and d: comparison plots of the spectroscopic radii calculated from our spectroscopic parameters and those from Manser et al. (2024), against the photometric radii. It is evident that the majority of photometric radii are larger than both sets of the spectroscopic radii.
Current usage metrics show cumulative count of Article Views (full-text article views including HTML views, PDF and ePub downloads, according to the available data) and Abstracts Views on Vision4Press platform.
Data correspond to usage on the plateform after 2015. The current usage metrics is available 48-96 hours after online publication and is updated daily on week days.
Initial download of the metrics may take a while.