Open Access
Fig. 12
Download original image
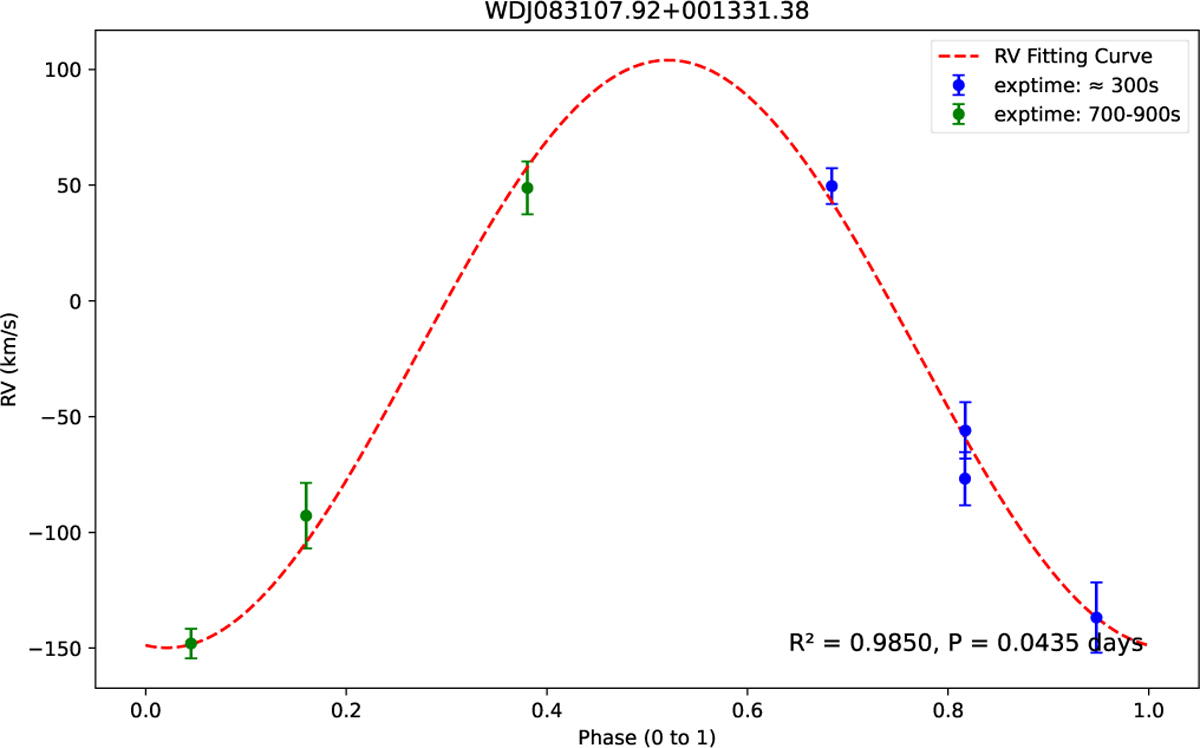
RV fitting curve of WDJ083107.92 +001331.38. The period is 0.0435 days, approximately 3750 s. The blue points correspond to an exposure time of about 300 s, accounting for less than 1/10 of the phase, while the green points correspond to an exposure time between 700 and 900 s, covering approximately 1/4 to 1/5 of the phase.
Current usage metrics show cumulative count of Article Views (full-text article views including HTML views, PDF and ePub downloads, according to the available data) and Abstracts Views on Vision4Press platform.
Data correspond to usage on the plateform after 2015. The current usage metrics is available 48-96 hours after online publication and is updated daily on week days.
Initial download of the metrics may take a while.