Fig. 9
Download original image
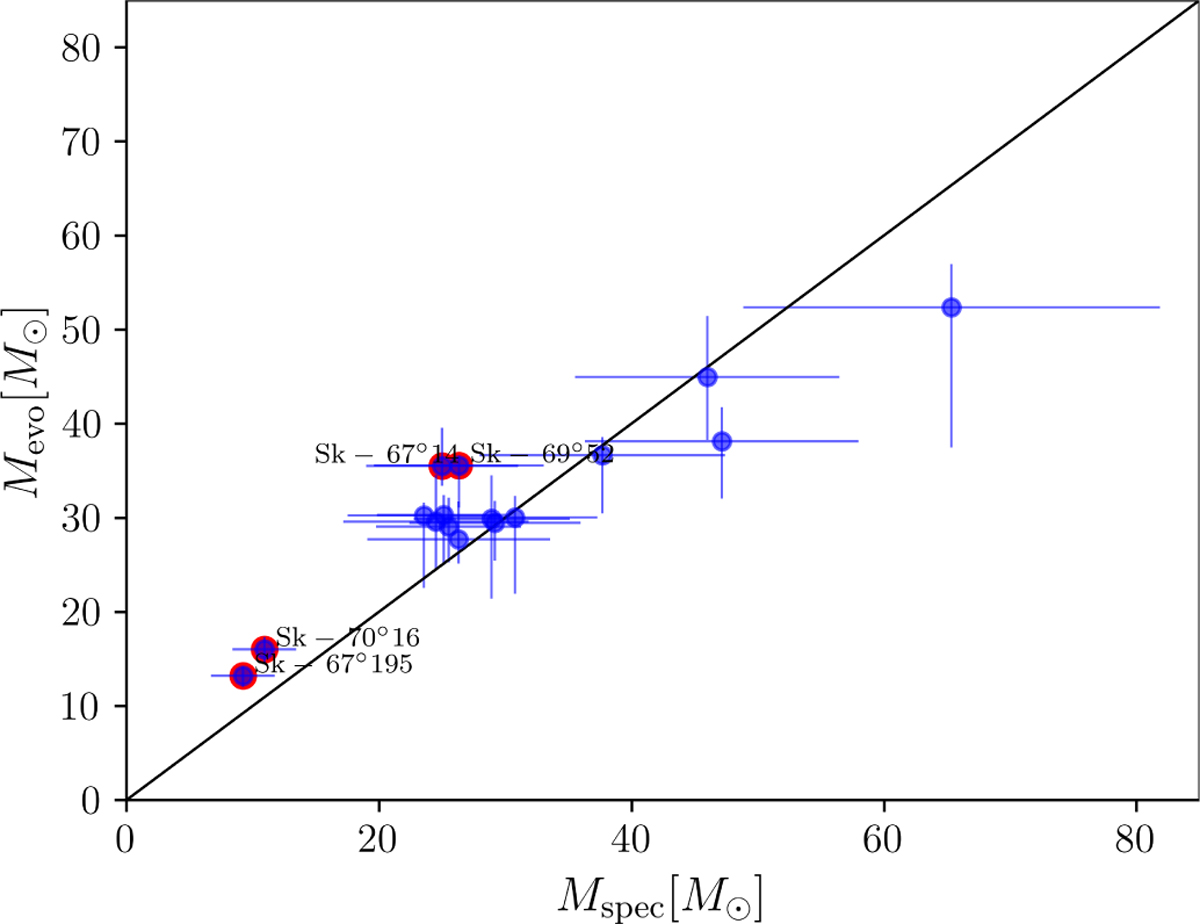
Blue circles show the spectroscopically obtained mass from our analysis Mspec vs. the mass produced by BONNSAI (Schneider et al. 2014) applied to evolutionary tracks from Brott et al. (2011) Mevo. Red circles overlaid onto the blue points depict stars that have a significant discrepancy between their Mspec and Mevo.
Current usage metrics show cumulative count of Article Views (full-text article views including HTML views, PDF and ePub downloads, according to the available data) and Abstracts Views on Vision4Press platform.
Data correspond to usage on the plateform after 2015. The current usage metrics is available 48-96 hours after online publication and is updated daily on week days.
Initial download of the metrics may take a while.