Fig. 7
Download original image
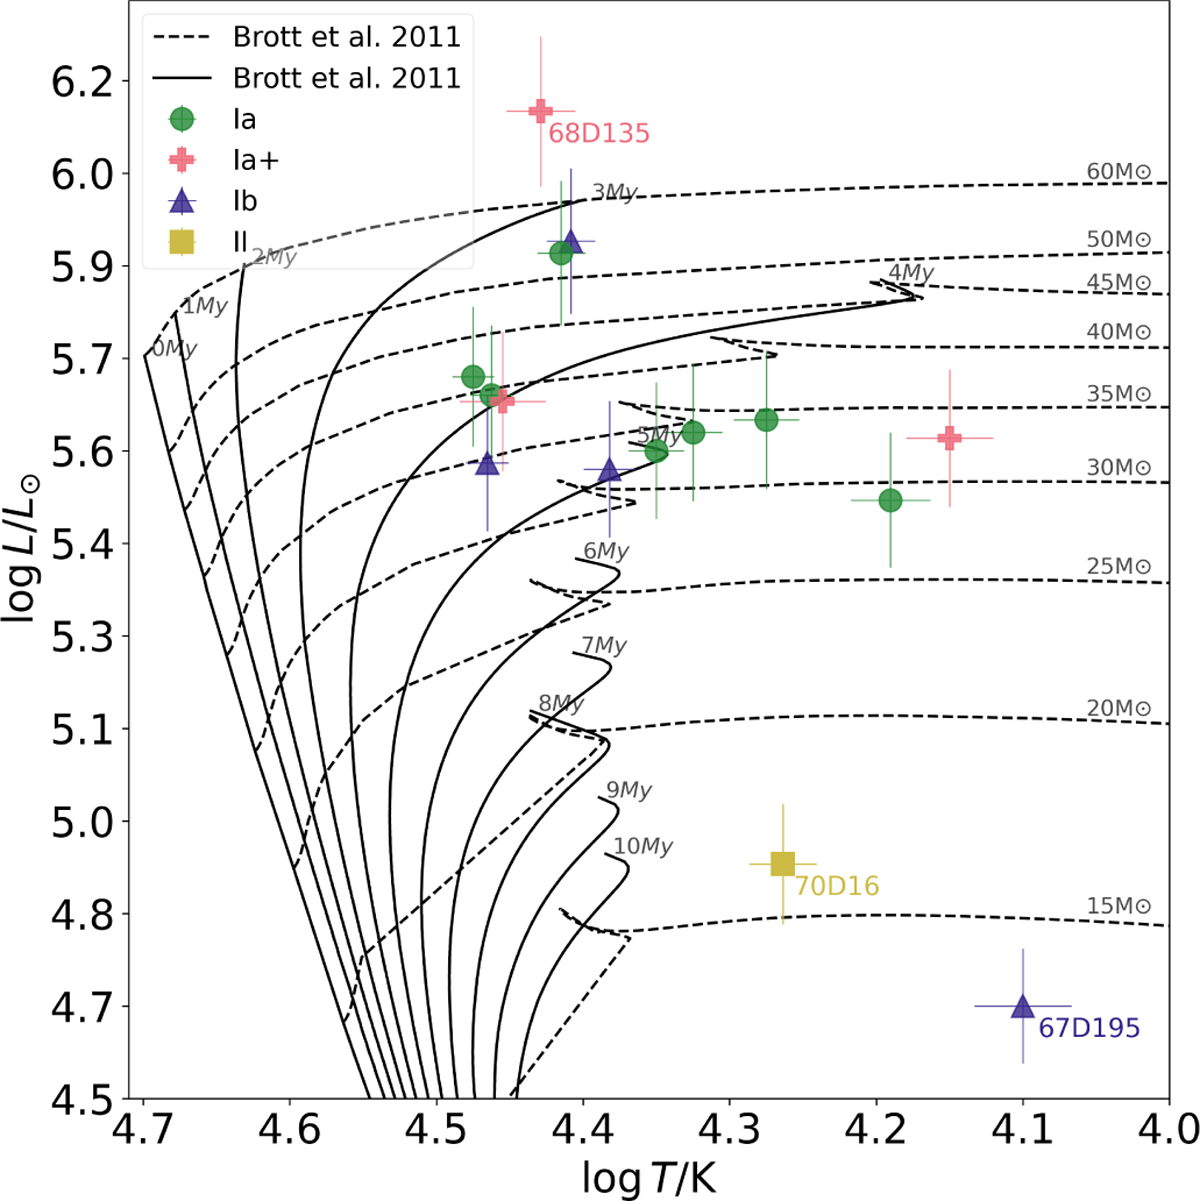
Hertzsprung-Russell diagram for our sample. The non-rotating isochrones for different ages (≈[0–10] Myr) are overlaid as solid black lines, and the evolutionary tracks for stellar masses in the range ≈[10– 60] M⊙ with a rotational velocity of 50 km s−1 are shown as dashed black lines. The isochrones and evolutionary tracks were adopted from Brott et al. (2011).
Current usage metrics show cumulative count of Article Views (full-text article views including HTML views, PDF and ePub downloads, according to the available data) and Abstracts Views on Vision4Press platform.
Data correspond to usage on the plateform after 2015. The current usage metrics is available 48-96 hours after online publication and is updated daily on week days.
Initial download of the metrics may take a while.