Fig. 21
Download original image
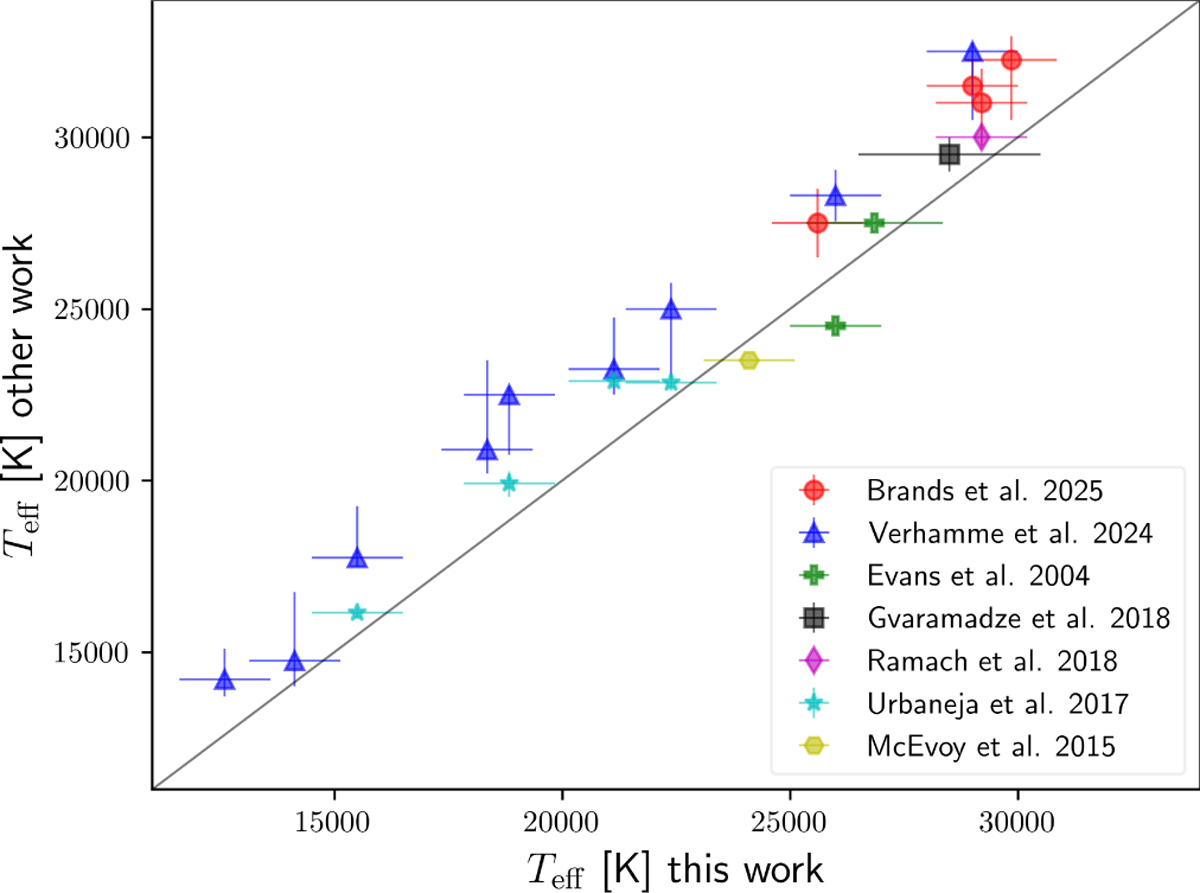
Comparison of our obtained Teff to previous studies. We present on the x-axis our effective temperature for each star and the comparison Teff from previous analyses on the y-axis. Blue triangles: Comparison to values obtained by Verhamme et al. (2024), Red circles: Comparison to values obtained by Brands et al. (2025). Green filled crosses: Comparison to values obtained by Evans et al. (2004). Black square: Comparison to values obtained by Gvaramadze et al. (2018). Magenta diamond: Comparison to values obtained by Ramachandran et al. (2018). Cyan star: Our Teff to the effective temperatures from Urbaneja et al. (2017). Yellow hexagon: Comparison to values obtained by McEvoy et al. (2015).
Current usage metrics show cumulative count of Article Views (full-text article views including HTML views, PDF and ePub downloads, according to the available data) and Abstracts Views on Vision4Press platform.
Data correspond to usage on the plateform after 2015. The current usage metrics is available 48-96 hours after online publication and is updated daily on week days.
Initial download of the metrics may take a while.