Fig. 2
Download original image
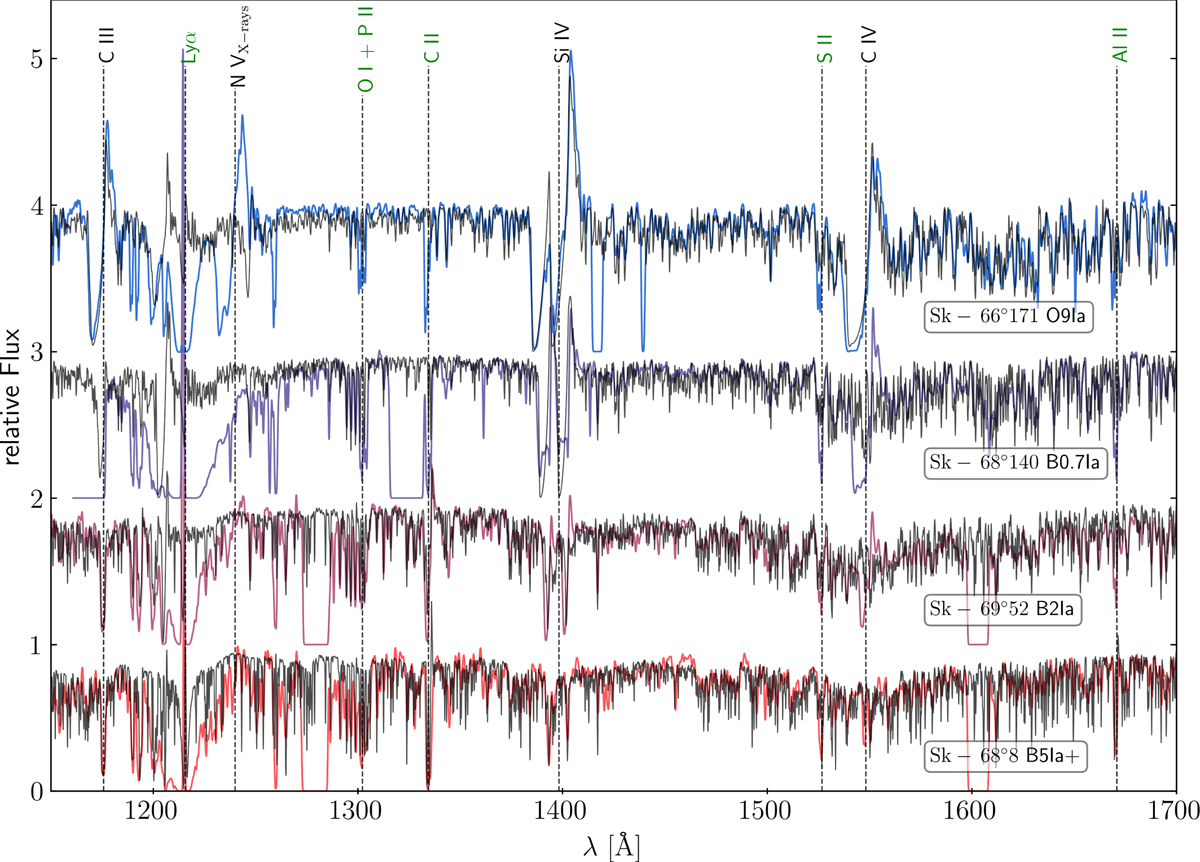
Normalised UV spectra in the range of the sample, with the line identification for the UV lines. For illustration purposes, an offset of one was added. The coloured lines show the observations. The black lines show the model fits for each of the respective stars. Stellar features are indicated in black line labels, whereas green line labels indicate interstellar features. The HST gap at ≈1300 in the spectra of Sk 69◦ 52, Sk 68◦ 8 is due to appending observations from COS G130M and COS G160M. The gap at 1600 Å is due to appending observations from COS G160M and COS G185M. Other UV fits are presented at Appendix I.
Current usage metrics show cumulative count of Article Views (full-text article views including HTML views, PDF and ePub downloads, according to the available data) and Abstracts Views on Vision4Press platform.
Data correspond to usage on the plateform after 2015. The current usage metrics is available 48-96 hours after online publication and is updated daily on week days.
Initial download of the metrics may take a while.