Fig. 16
Download original image
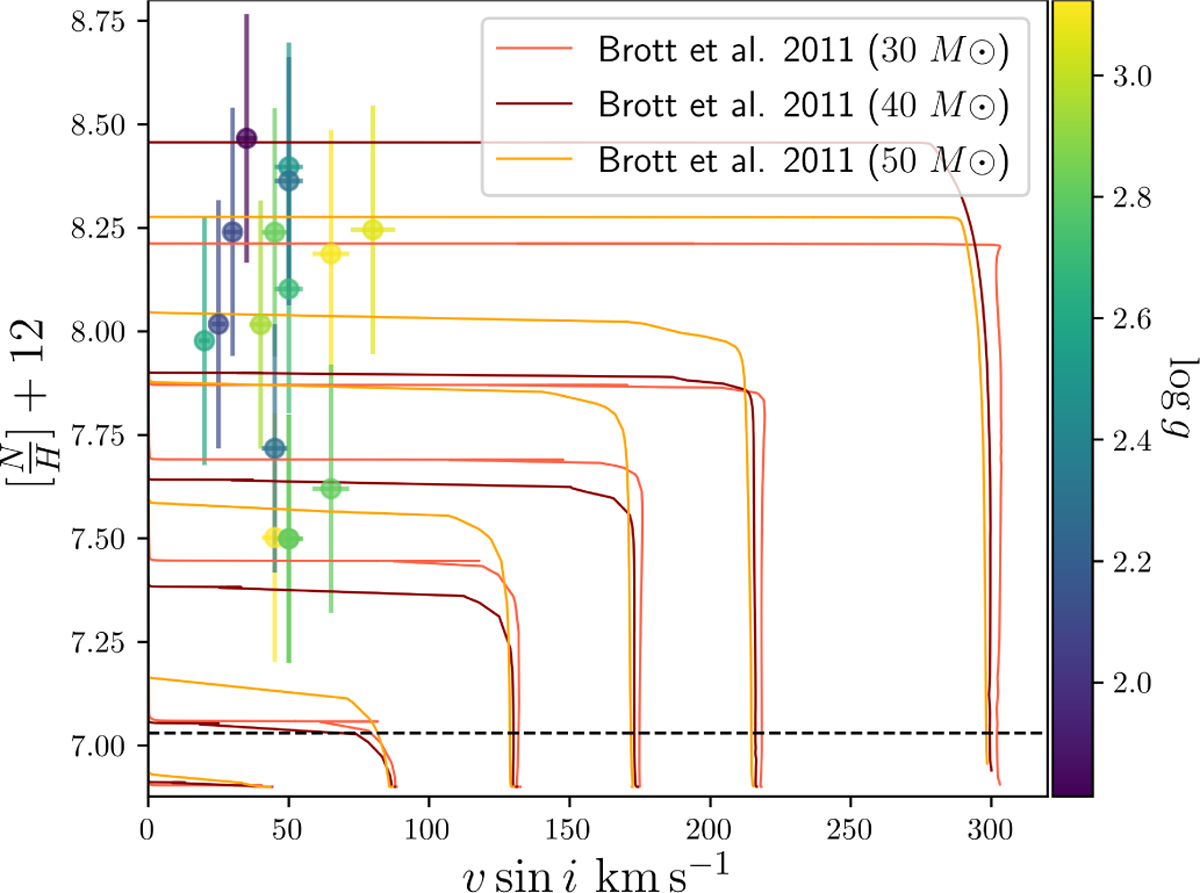
Nitrogen abundance (by number) vs. νrot sin i. The colour scheme corresponds to the value of log g, and the evolutionary tracks are computed for initial masses of 30 M⊙, 40 M⊙ and 50 M⊙ (red, brown, and orange solid lines respectively) for initial rotational velocities of 50, 110, 170, 220, 270 380 km s−1 (Brott et al. 2011), which we multiplied by a factor of π/4 to take into account the inclination of the rotation axis (Hunter et al. 2008). The black dashed line represents the LMC baseline nitrogen abundance.
Current usage metrics show cumulative count of Article Views (full-text article views including HTML views, PDF and ePub downloads, according to the available data) and Abstracts Views on Vision4Press platform.
Data correspond to usage on the plateform after 2015. The current usage metrics is available 48-96 hours after online publication and is updated daily on week days.
Initial download of the metrics may take a while.