Fig. 12
Download original image
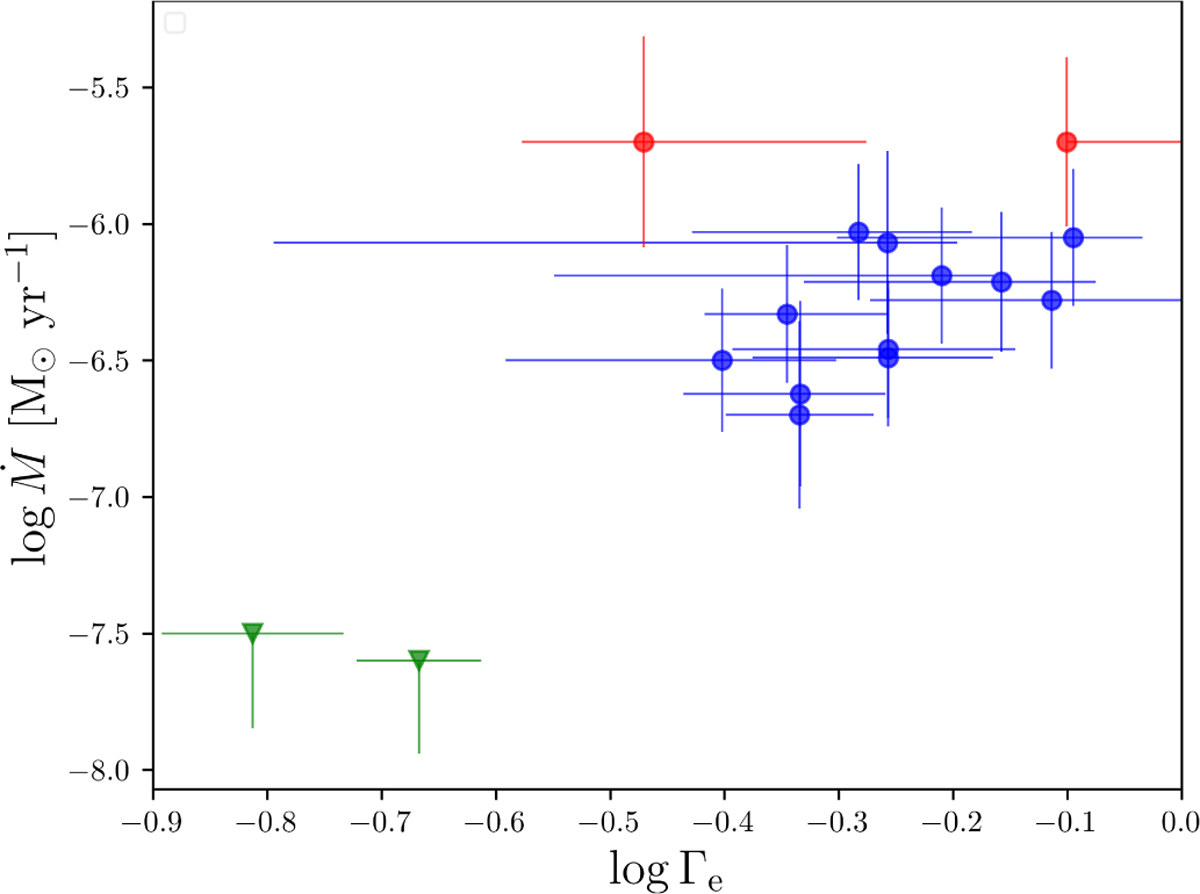
![]() vs. Γe. The green triangles indicate the objects Sk −67◦ 195 and Sk −70◦ 16, the mass-loss rates of which are considered upper limits. The red points correspond to the hypergiants Sk −67◦ 279 and Sk −68◦ 135.
vs. Γe. The green triangles indicate the objects Sk −67◦ 195 and Sk −70◦ 16, the mass-loss rates of which are considered upper limits. The red points correspond to the hypergiants Sk −67◦ 279 and Sk −68◦ 135.
Current usage metrics show cumulative count of Article Views (full-text article views including HTML views, PDF and ePub downloads, according to the available data) and Abstracts Views on Vision4Press platform.
Data correspond to usage on the plateform after 2015. The current usage metrics is available 48-96 hours after online publication and is updated daily on week days.
Initial download of the metrics may take a while.