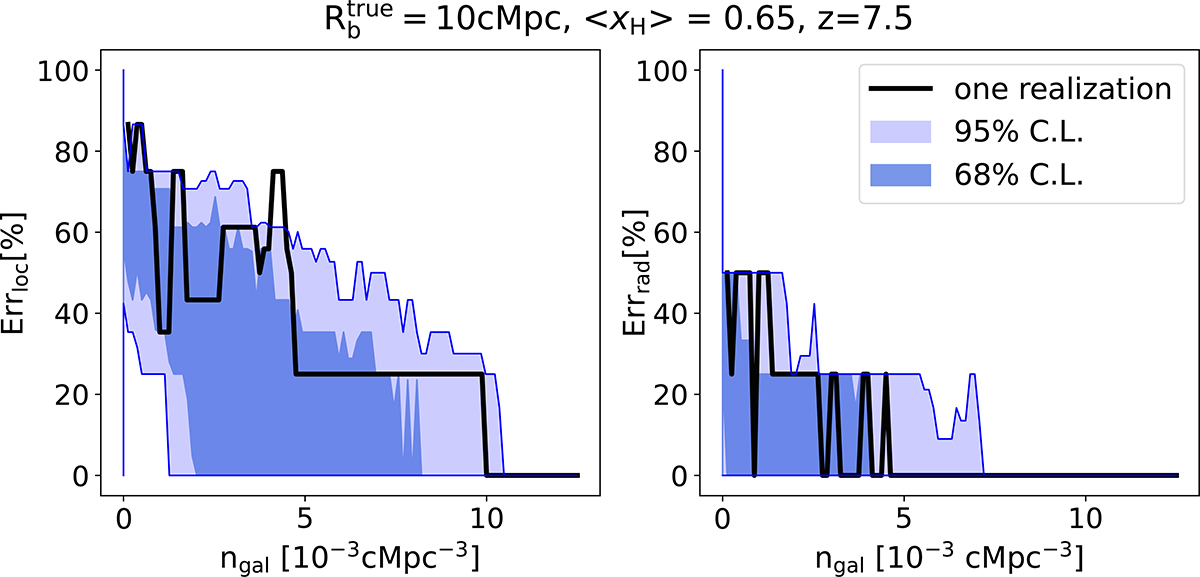
Fig. 8.
Download original image
Fractional errors of the maximum likelihood HII bubble center (left) and radius (right) as a function of the number density of the observed galaxies. The black curve corresponds to a single realization of the EoR morphology and galaxy samples. The light (dark) blue region corresponds to the 95th (68th) percentile of fractional errors obtained from 100 realizations. With ngal≳0.01 galaxies cMpc−3, the fractional errors drop below the grid resolution we used to calculate the likelihoods (1.5 cMpc).
Current usage metrics show cumulative count of Article Views (full-text article views including HTML views, PDF and ePub downloads, according to the available data) and Abstracts Views on Vision4Press platform.
Data correspond to usage on the plateform after 2015. The current usage metrics is available 48-96 hours after online publication and is updated daily on week days.
Initial download of the metrics may take a while.