Fig. 7.
Download original image
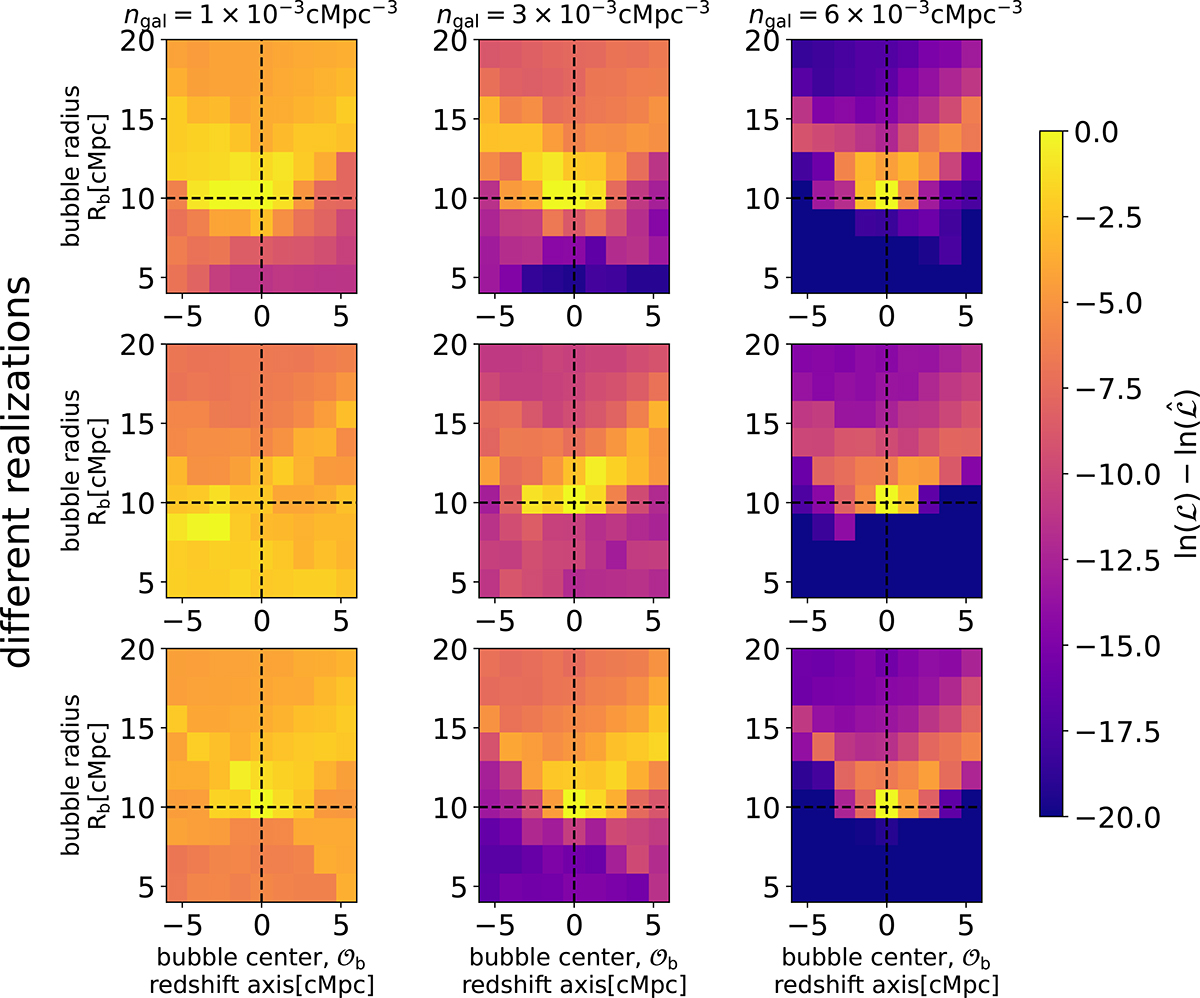
Two-dimensional slices through the log likelihood, normalized to the maximum value in each panel. The vertical and horizontal axis in each panel correspond to the bubble radius, Rb, and redshift axis of the center, ![]() . The true values,
. The true values, ![]() , are demarcated with the dashed lines. The mock observation in this example was made at z = 7.5, assuming
, are demarcated with the dashed lines. The mock observation in this example was made at z = 7.5, assuming ![]() . The different columns represent different numbers of galaxies that were used for inference (8 galaxies on the left, 24 galaxies in the middle, and 48 galaxies on the right). The different rows correspond to different realizations of the EoR morphology and galaxy samples.
. The different columns represent different numbers of galaxies that were used for inference (8 galaxies on the left, 24 galaxies in the middle, and 48 galaxies on the right). The different rows correspond to different realizations of the EoR morphology and galaxy samples.
Current usage metrics show cumulative count of Article Views (full-text article views including HTML views, PDF and ePub downloads, according to the available data) and Abstracts Views on Vision4Press platform.
Data correspond to usage on the plateform after 2015. The current usage metrics is available 48-96 hours after online publication and is updated daily on week days.
Initial download of the metrics may take a while.