Fig. 6.
Download original image
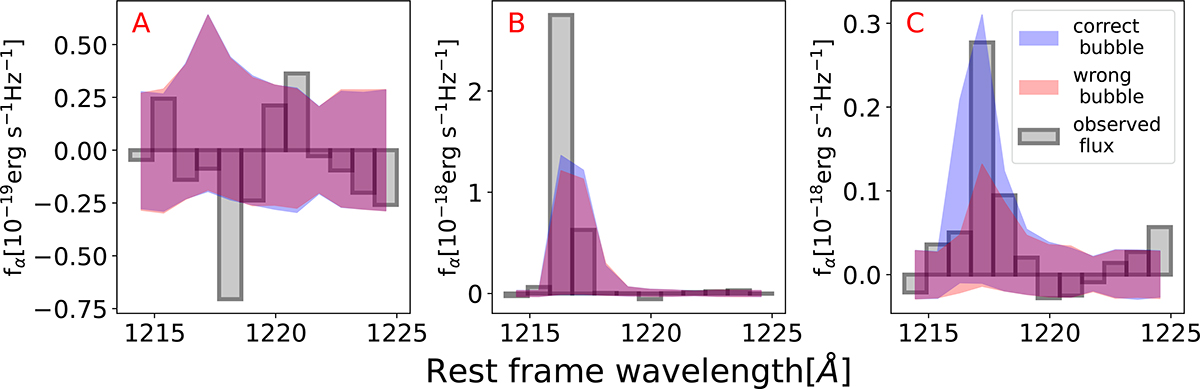
Observed flux (gray) corresponding to the galaxies A, B, and C from the mock observation shown in Fig. 1. We show the 68% C.L. of the likelihood assuming the correct HII bubble location and radius in blue, ![]() . We show the 68% C.L. of the flux likelihood assuming the correct HII bubble location, but a slightly smaller radius in red,
. We show the 68% C.L. of the flux likelihood assuming the correct HII bubble location, but a slightly smaller radius in red, ![]() .
.
Current usage metrics show cumulative count of Article Views (full-text article views including HTML views, PDF and ePub downloads, according to the available data) and Abstracts Views on Vision4Press platform.
Data correspond to usage on the plateform after 2015. The current usage metrics is available 48-96 hours after online publication and is updated daily on week days.
Initial download of the metrics may take a while.