Fig. 5.
Download original image
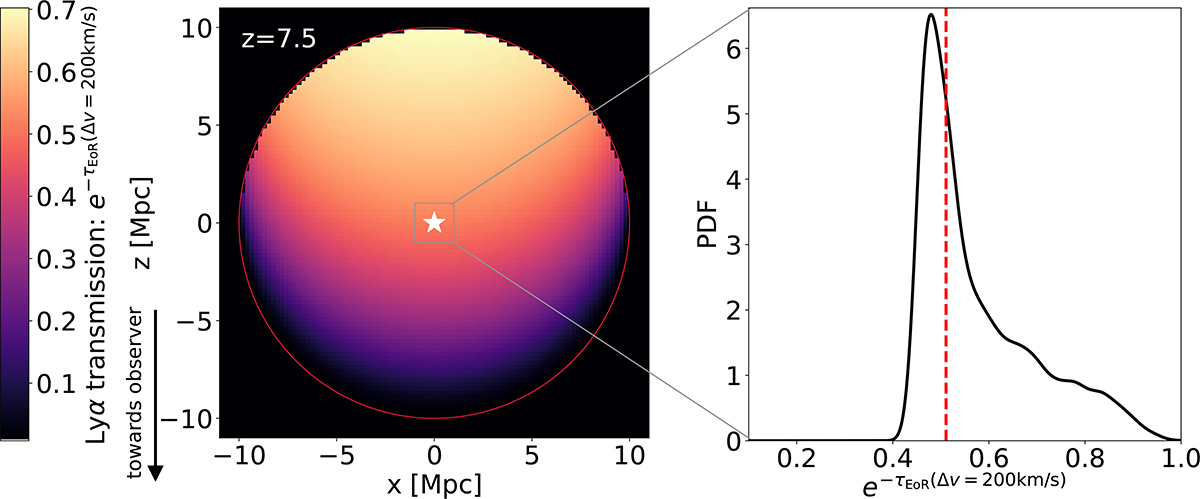
Left panel: Mean Lyα transmission evaluated at Δv=+200 km/s (e−τEoR(Δv=+200) km/s) as a function of the position inside an ionized bubble. The observer is located toward the bottom of the figure. We computed the mean transmission by averaging over 10 000 realizations of EoR morphologies, given an assumed neutral fraction of ![]() at z = 7.5 (see text for details). Right panel: Distribution of Lyα transmission at Δv=+200 km/s from these realizations, evaluated at a fixed position inside the bubble denoted by the white star (see text for details). The mean is marked by the vertical dashed line.
at z = 7.5 (see text for details). Right panel: Distribution of Lyα transmission at Δv=+200 km/s from these realizations, evaluated at a fixed position inside the bubble denoted by the white star (see text for details). The mean is marked by the vertical dashed line.
Current usage metrics show cumulative count of Article Views (full-text article views including HTML views, PDF and ePub downloads, according to the available data) and Abstracts Views on Vision4Press platform.
Data correspond to usage on the plateform after 2015. The current usage metrics is available 48-96 hours after online publication and is updated daily on week days.
Initial download of the metrics may take a while.