Fig. 3.
Download original image
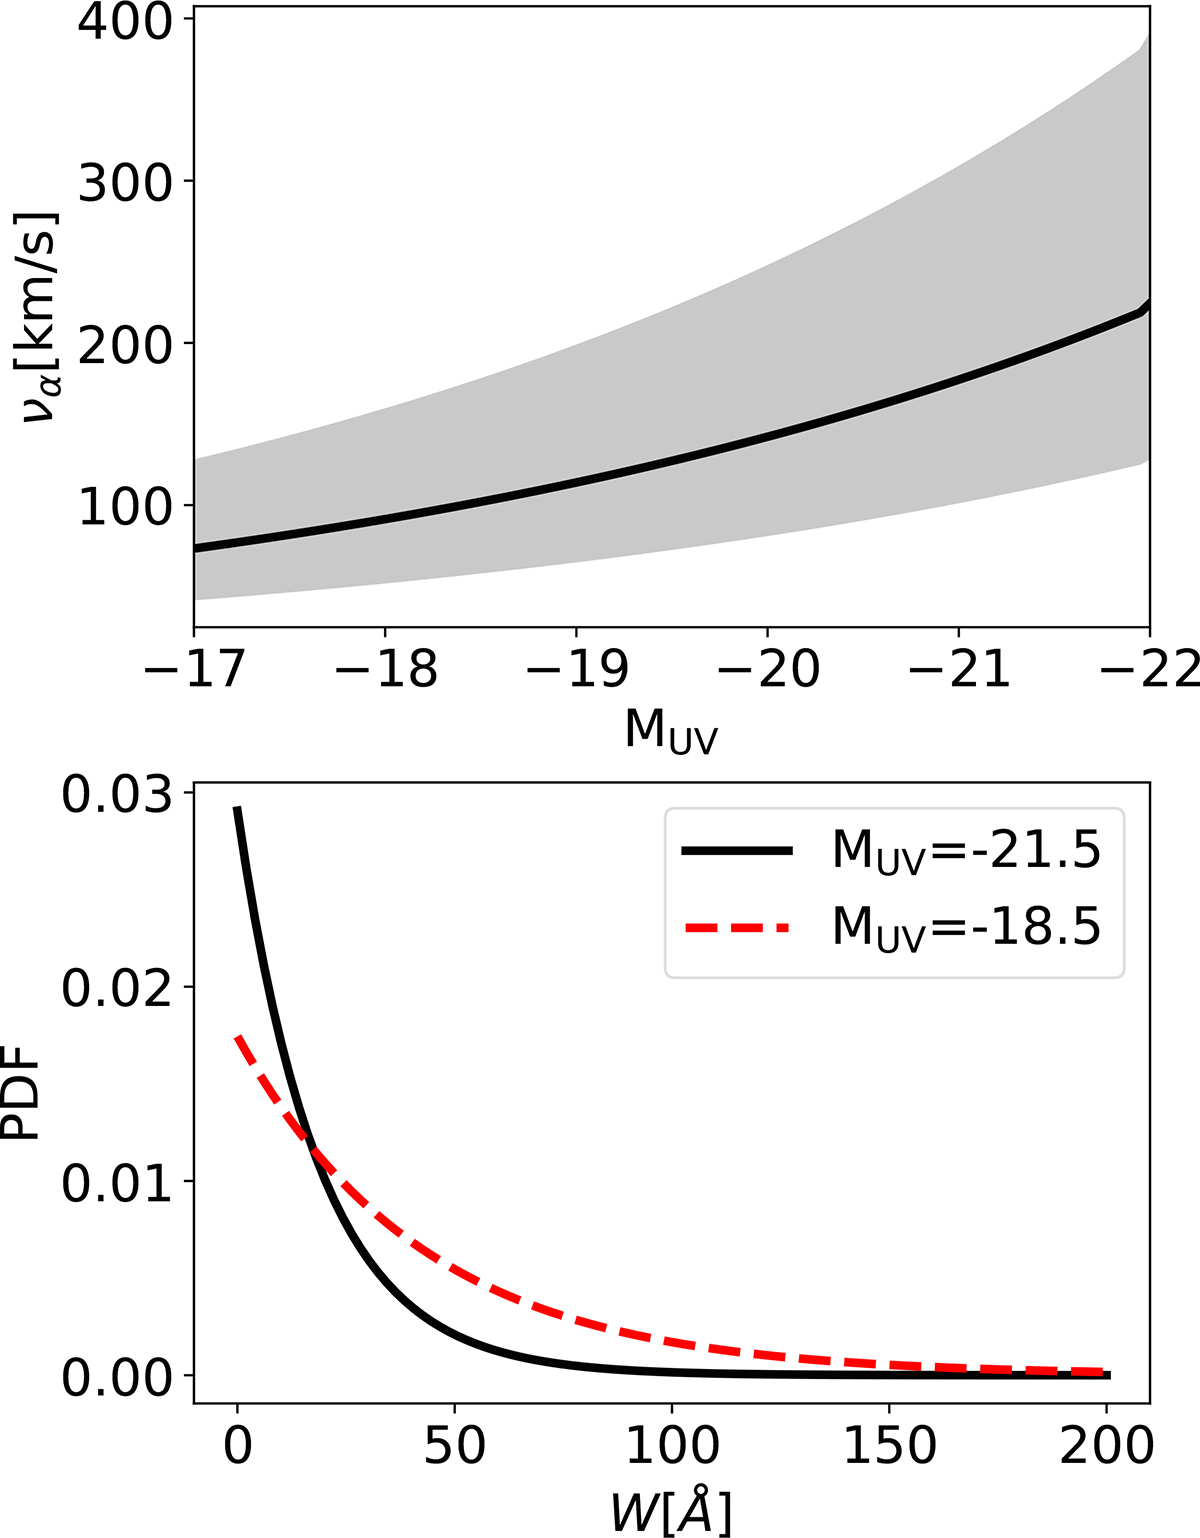
Upper panel: Mean (black line) and 1σ (shaded region) of the velocity offset distribution as a function of UV magnitude (Eq. (4)). Lower panel: PDF of the Lyman-alpha rest-frame equivalent widths. The dashed black and red curves represent the distribution of the equivalent widths (W) for Lyman-α emitters (Eq. (7)). The equivalent widths of the nonemitters are described by a delta function at W = 0 Å (not shown) normalized such that the integral of the PDF is 1. The distribution is shown for MUV=−18.5 and –21.5.
Current usage metrics show cumulative count of Article Views (full-text article views including HTML views, PDF and ePub downloads, according to the available data) and Abstracts Views on Vision4Press platform.
Data correspond to usage on the plateform after 2015. The current usage metrics is available 48-96 hours after online publication and is updated daily on week days.
Initial download of the metrics may take a while.