Fig. 2.
Download original image
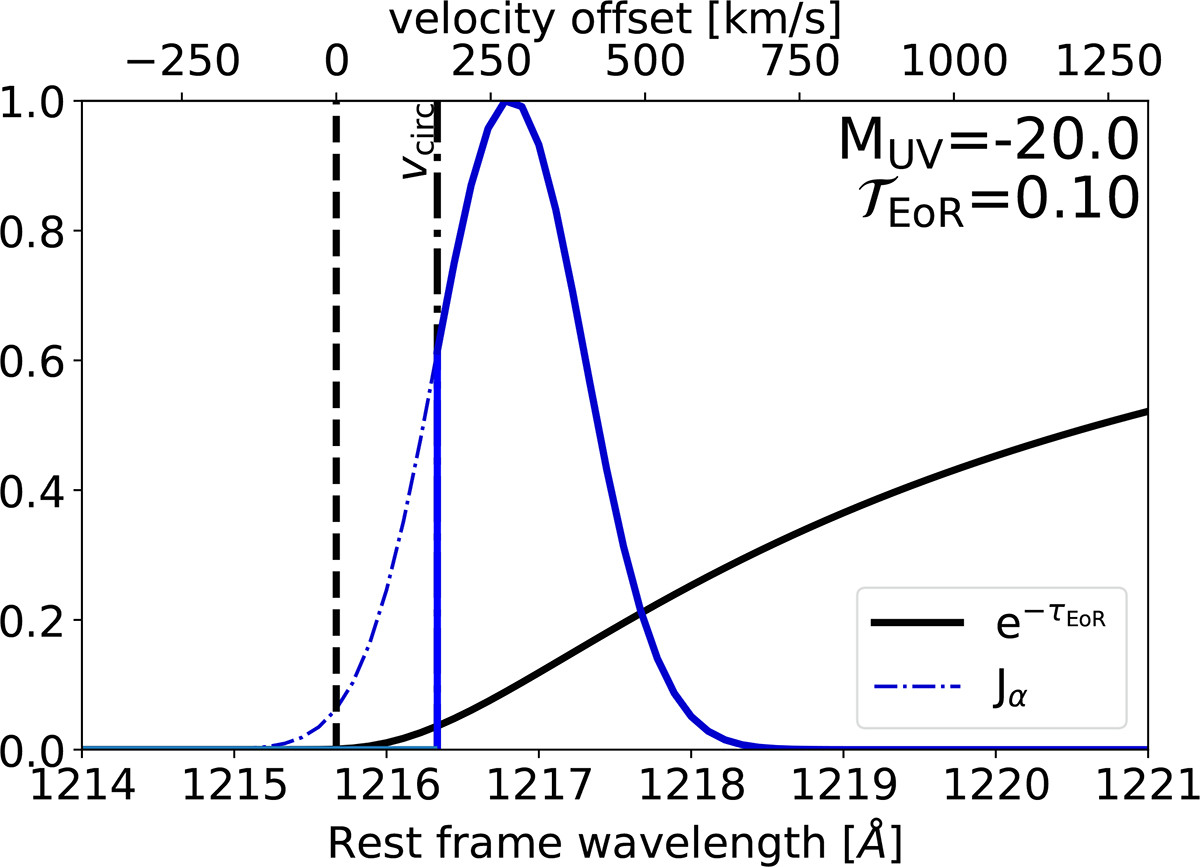
Emergent Lyman-alpha line and IGM opacity as a function of wavelength. The solid blue line represents the normalized Lyman-α emergent profile, and the dot-dashed blue line demarcates the flux absorbed by the circumgalactic medium blueward of the circular velocity of the galaxy. The solid black line illustrates an IGM damping wing attenuation profile, taken from a random sightline at ![]() and Rb = 10 cMpc (see text for details). The Lyman-alpha transmission integrated over all wavelengths for this example would be
and Rb = 10 cMpc (see text for details). The Lyman-alpha transmission integrated over all wavelengths for this example would be ![]() .
.
Current usage metrics show cumulative count of Article Views (full-text article views including HTML views, PDF and ePub downloads, according to the available data) and Abstracts Views on Vision4Press platform.
Data correspond to usage on the plateform after 2015. The current usage metrics is available 48-96 hours after online publication and is updated daily on week days.
Initial download of the metrics may take a while.