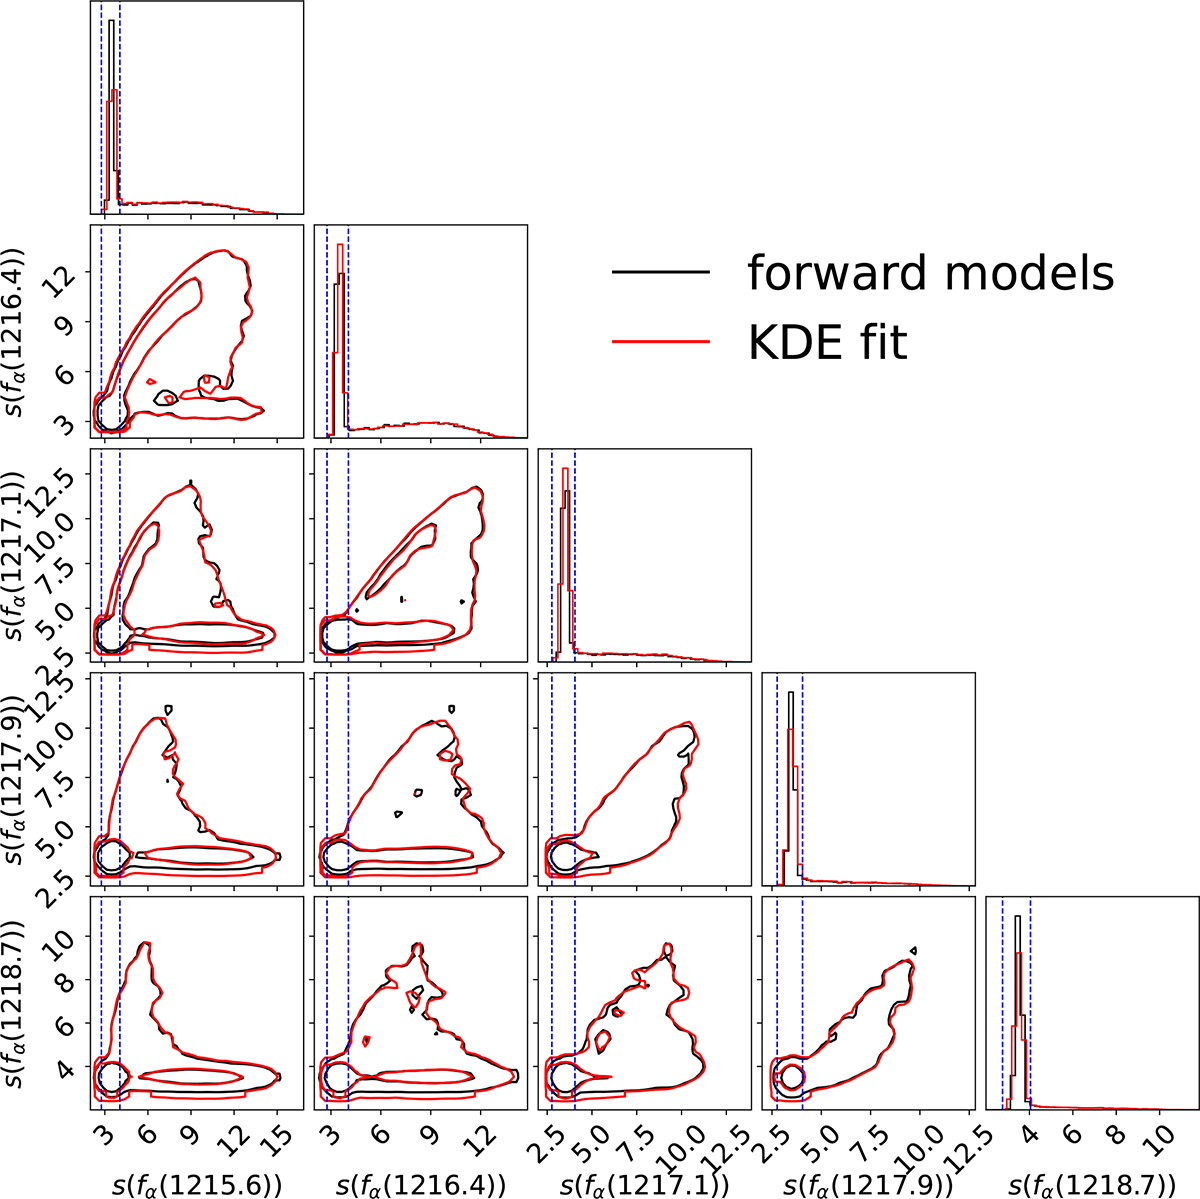
Fig. A.1.
Download original image
Corner plot of scaled flux spectra and the KDE fit to the forward models. Black contours represent 68% and 95% C.L. of the distribution of forward models for a galaxy located in the center of a Rb = 10cMpc ionized bubble. Red contours represent same distributions for the KDE fit to the forward models. Blue dashed lines mark regions with ±2σ of the noise of the spectrum. Contours outside of these dashed lines represent Lyman-α emission, with non-negligible correlation between bins.
Current usage metrics show cumulative count of Article Views (full-text article views including HTML views, PDF and ePub downloads, according to the available data) and Abstracts Views on Vision4Press platform.
Data correspond to usage on the plateform after 2015. The current usage metrics is available 48-96 hours after online publication and is updated daily on week days.
Initial download of the metrics may take a while.