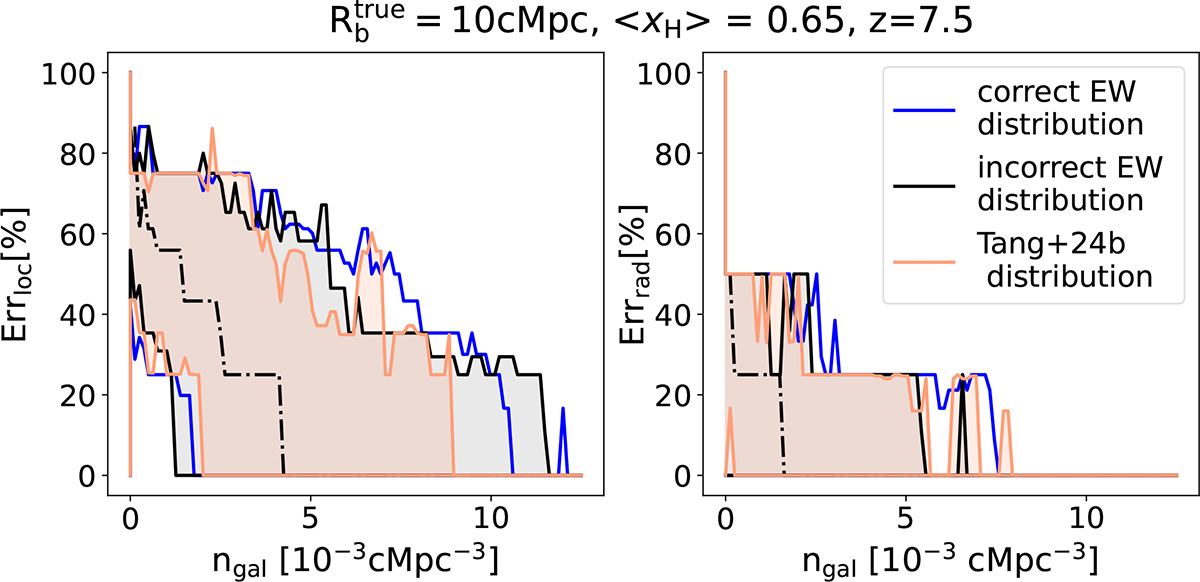
Fig. 11.
Download original image
Same as Fig. 8, but including in gray (orange) the 95% C.L. on the fractional errors assuming that the EW distribution we used to interpret the mock observation is a Gaussian constructed from the same data (log-normal distribution from Tang et al. 2024a). In other words, the mock observations and forward models are generated using different EW distributions (see text for details). The fact that the C.L. demarcated in gray, orange and blue roughly overlap indicates that our results are not sensitive to our choice of the emergent EW distribution.
Current usage metrics show cumulative count of Article Views (full-text article views including HTML views, PDF and ePub downloads, according to the available data) and Abstracts Views on Vision4Press platform.
Data correspond to usage on the plateform after 2015. The current usage metrics is available 48-96 hours after online publication and is updated daily on week days.
Initial download of the metrics may take a while.