Fig. A.1
Download original image
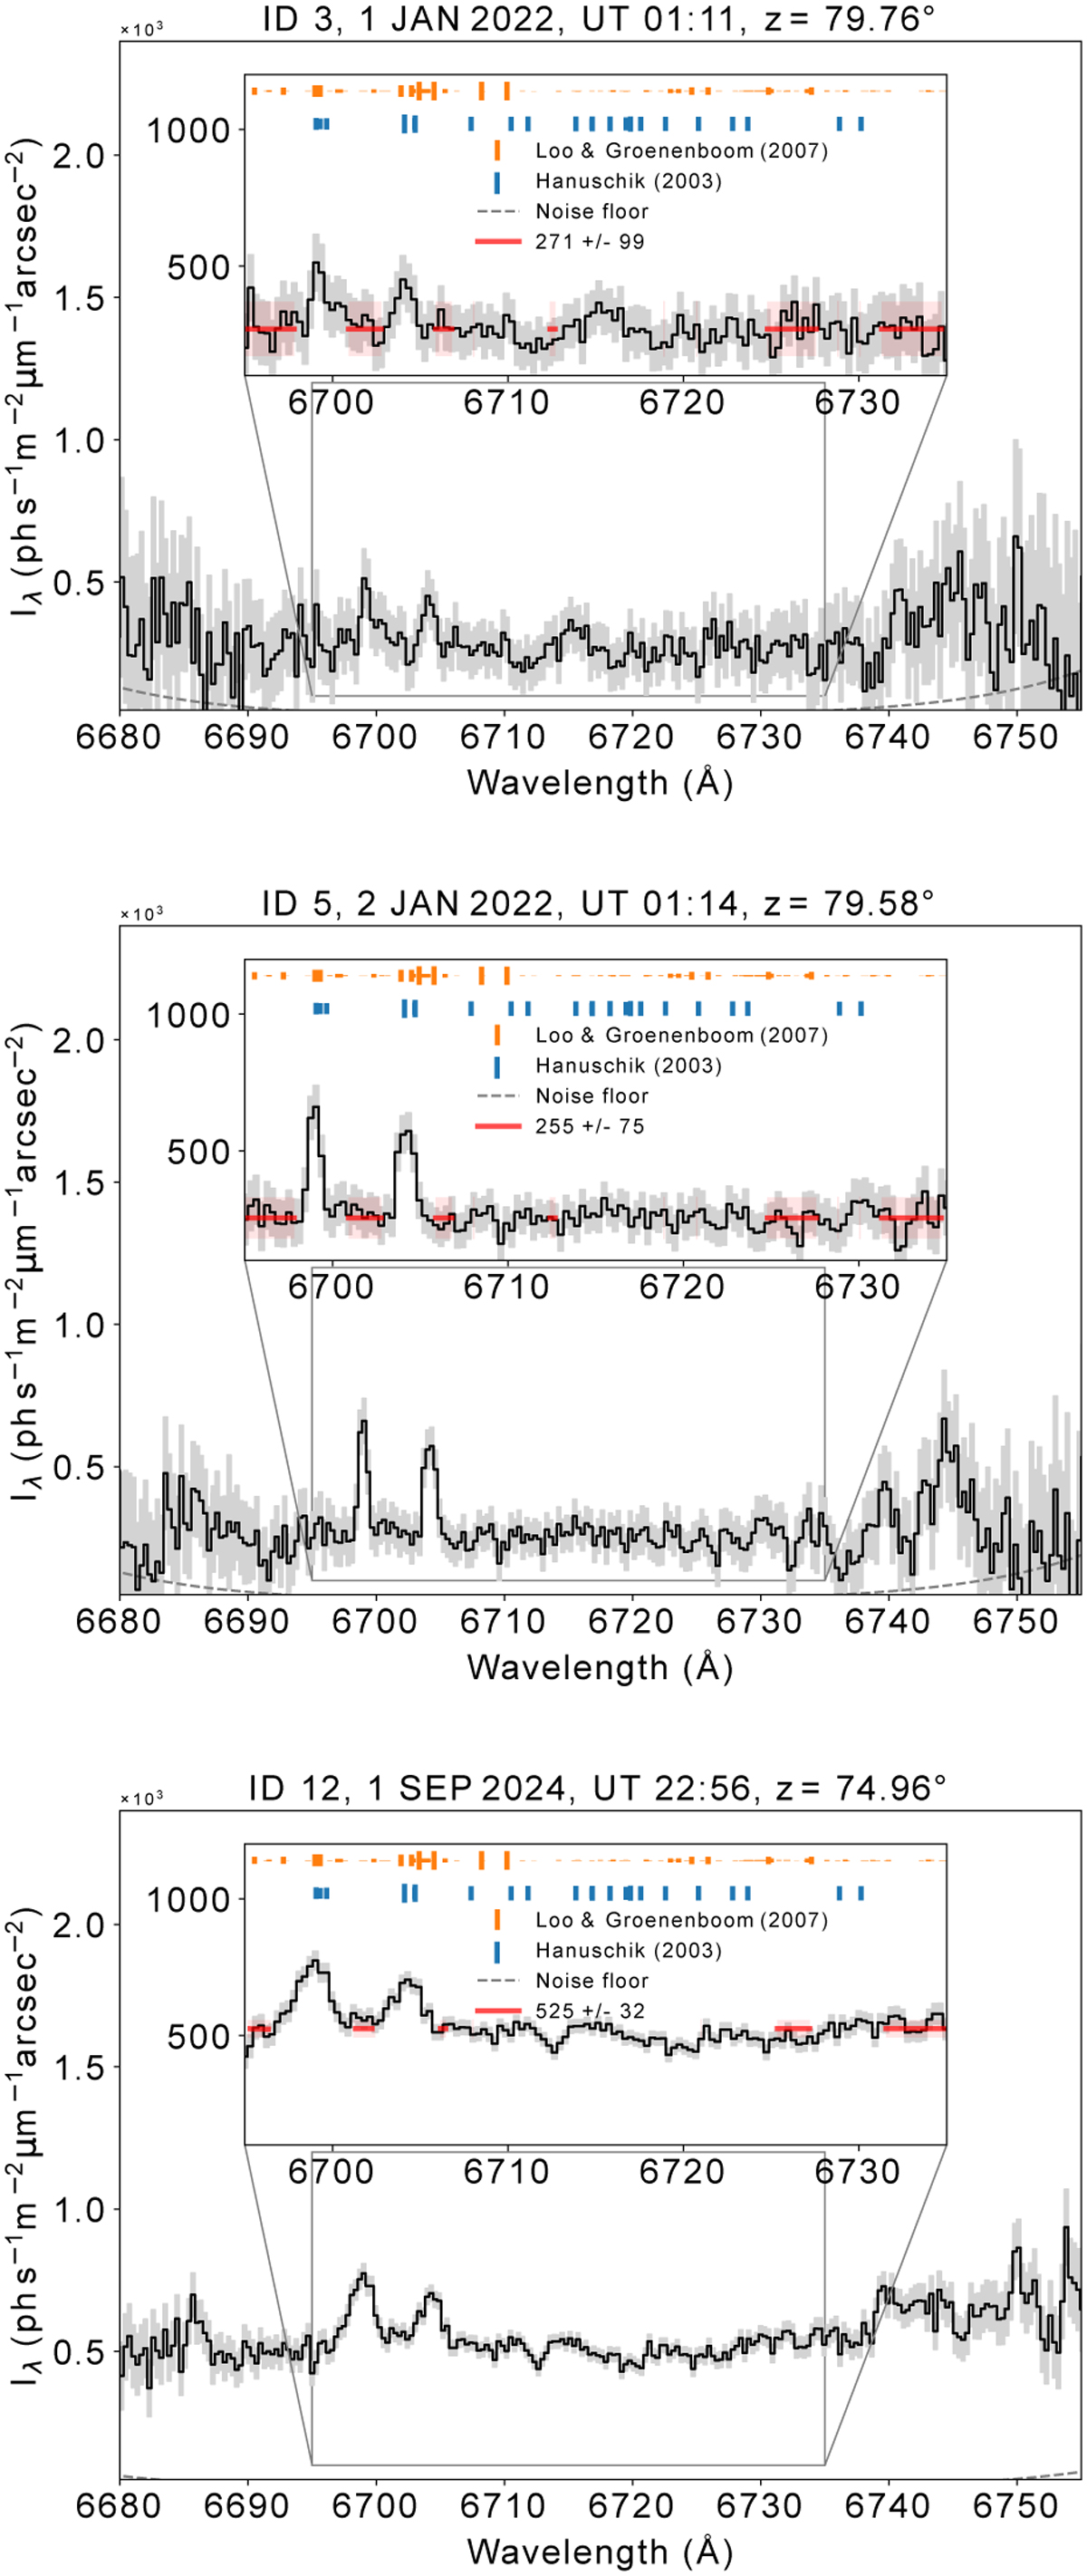
Apparent airglow spectra observed in 6720 Å band. The 2022 spectra were recorded with a 0.5″ slit whereas, the 2024 spectra are recorded with a 1.3″ slit. Spectral lines found in Hanuschik (2003) are indicated with blue ticks, with the tick length indicating relative intensity. Locations of computed OH lines by van der Loo & Groenenboom (2007, 2008) are shown with orange ticks, with the tick length indicating the line’s Einstein coefficient. The noise floor is shown as a dashed gray line, and the spectral regions used for sampling the continuum are indicated in red.
Current usage metrics show cumulative count of Article Views (full-text article views including HTML views, PDF and ePub downloads, according to the available data) and Abstracts Views on Vision4Press platform.
Data correspond to usage on the plateform after 2015. The current usage metrics is available 48-96 hours after online publication and is updated daily on week days.
Initial download of the metrics may take a while.