Fig. 9.
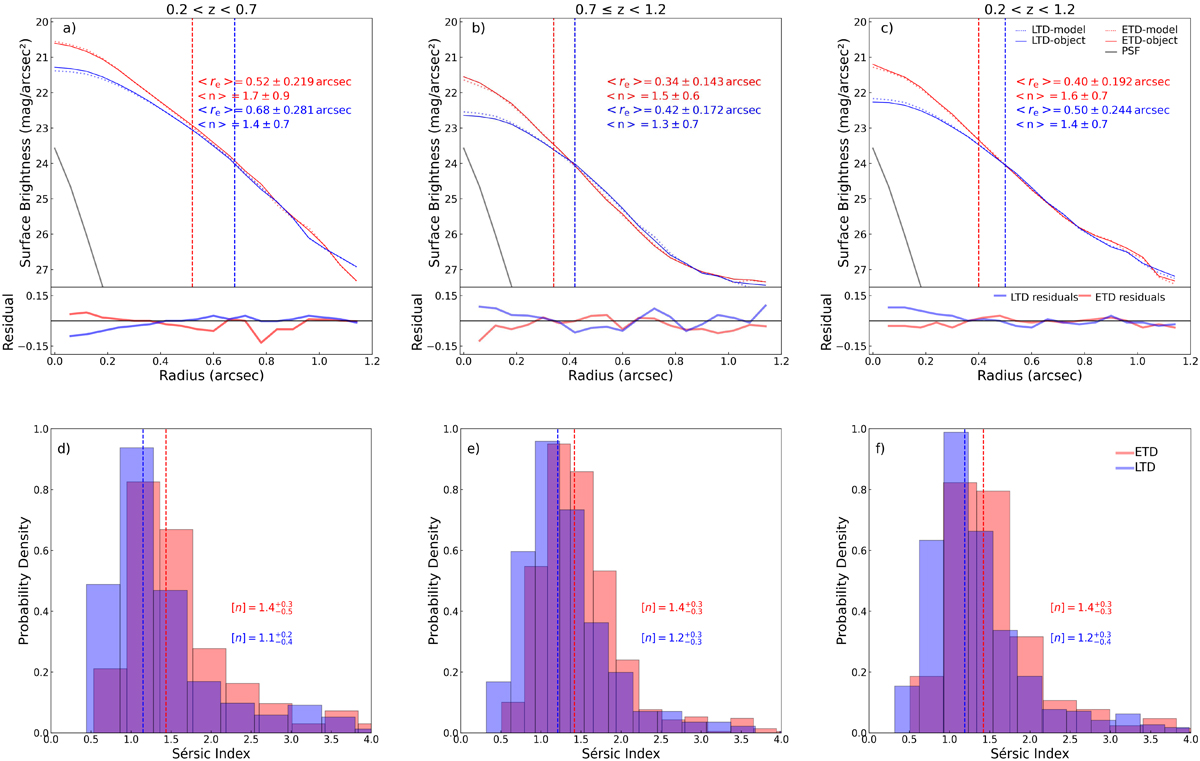
Download original image
Surface brightness profiles (top panels) of ETDs (red) and LTDs (blue) and Sérsic index distributions (bottom panels) in the I band. From left to right: Distributions at 0.2 < z < 0.7 (left) and 0.7 ≤ z < 1.2 (center), as well as the distribution over the entire redshift range (0.2 < z < 1.2, right), are shown. By fitting the surface brightness distribution of each galaxy using GALFIT (Peng et al. 2010) and then averaging the superposition, the effective radius re (also shown in vertical dashed lines) and the Sérsic index with ±1σ errors are imposed on each top panel. In each top panel, the average surface brightness profiles of the observed ETDs (LTDs) and their best-fit models are depicted by the solid and dashed red (blue) lines, respectively, whereas the residual between observation and model of ETDs (LTDs) is shown in red (blue). The point spread function (PSF) distribution is shown in grey. The bottom panels present the corresponding distribution of Sérsic index for each class of galaxies at a specific redshift bin. The median value of Sérsic index distribution for ETDs (LTDs) are marked and highlighted by the vertical dashed line in red (blue). The errors of median Sérsic indices represent the ±25th of median values.
Current usage metrics show cumulative count of Article Views (full-text article views including HTML views, PDF and ePub downloads, according to the available data) and Abstracts Views on Vision4Press platform.
Data correspond to usage on the plateform after 2015. The current usage metrics is available 48-96 hours after online publication and is updated daily on week days.
Initial download of the metrics may take a while.