Fig. 8.
Download original image
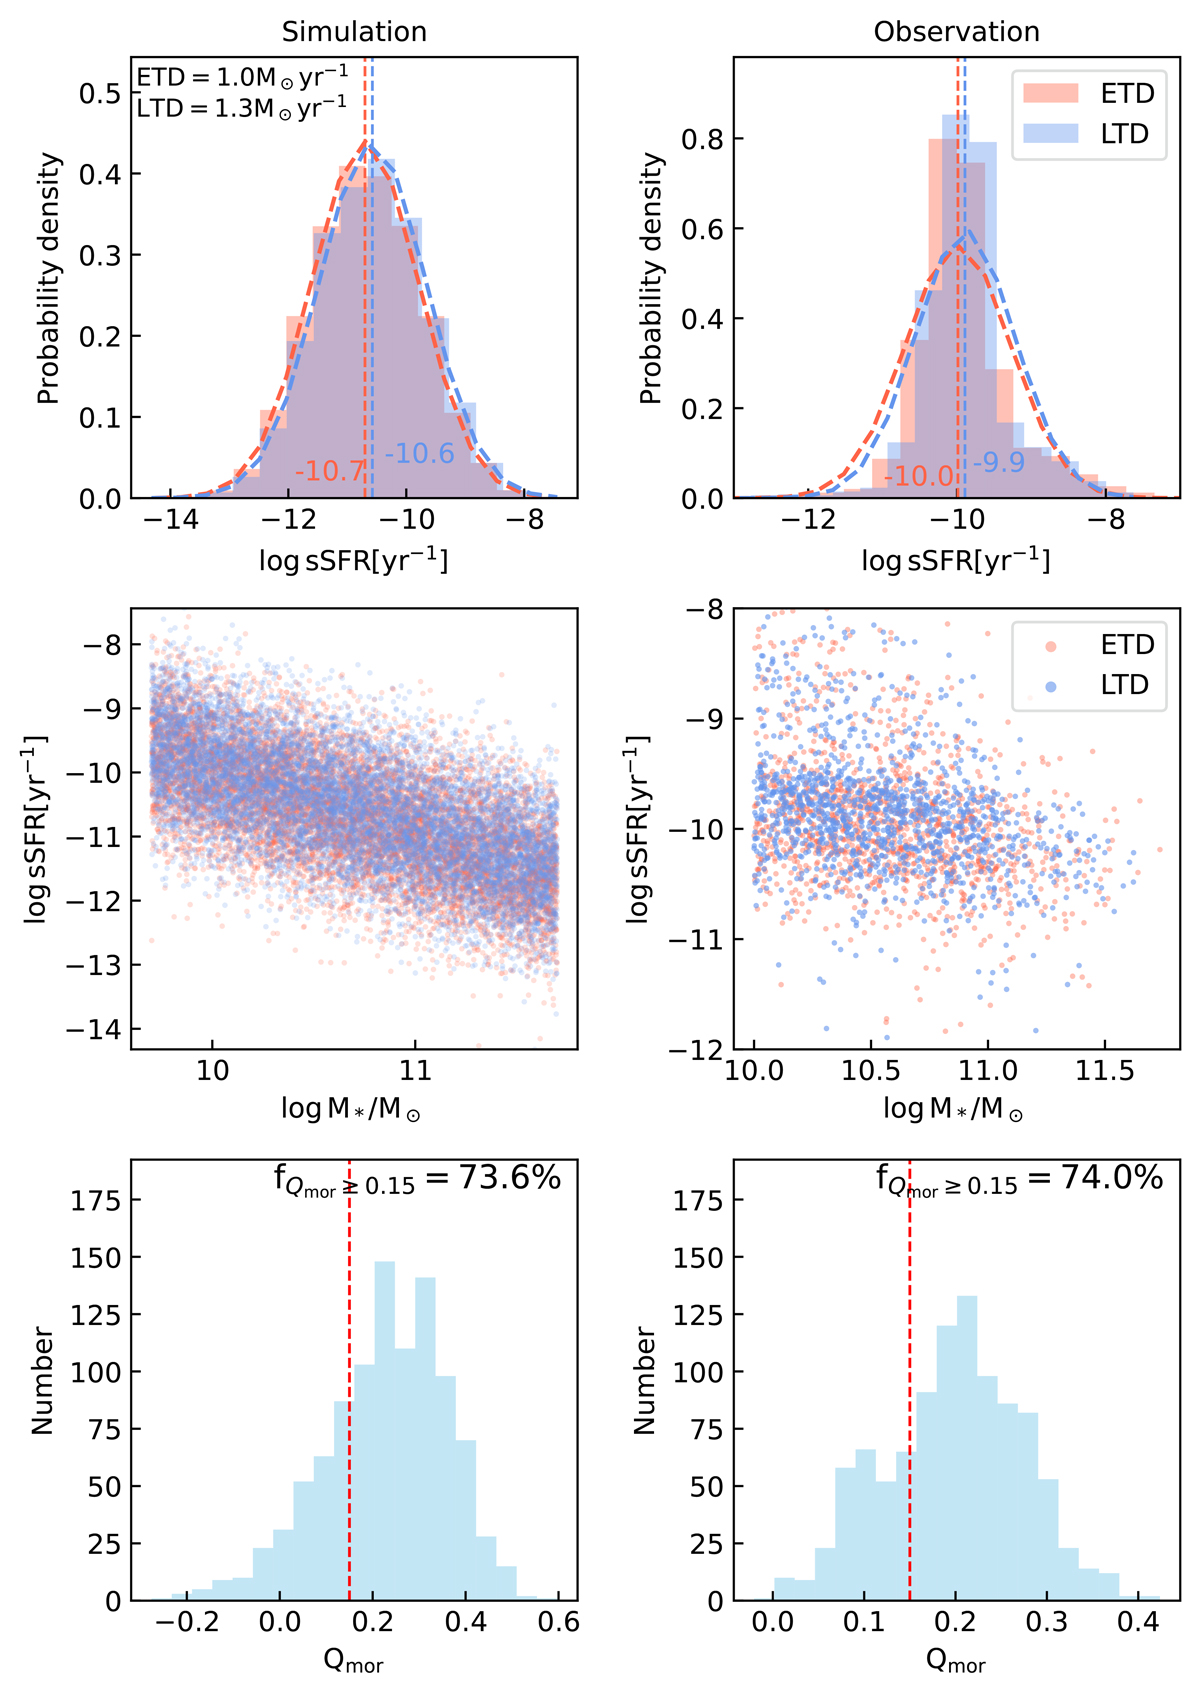
Comparisons of simulation (left) and observations (right) results. In the left panels, we assumed that there are 10 000 galaxies with stellar mass spanning uniformly from 109.7 M⊙ to 1011.7 M⊙ in each simulation subsample (ETDs vs. LTDs). Both subsamples have normal distributions of SFR but the mean SFRs between them are different (see upper left corner for details). The upper left panel shows the normalized histograms of sSFR for ETDs (red) and LTDs (blue), fitted by using the normal distribution (dashed line). The corresponding mean sSFR values in the log scale are displayed near the vertical dashed lines. The center left panel presents the sSFR-mass distribution. The lower left panel depicts a histogram of Qmor, obtained by the random sampling of 500 galaxies in each simulation subsample, with the process repeated 1000 times. The red vertical dashed line represents the threshold of Qmor = 0.15, and the fraction of Qmor ≥ 0.15 is shown at the top. The right panels show similar results as the left panels, but for a real sample from this work, including 1296 ETDs and 1296 LTDs.
Current usage metrics show cumulative count of Article Views (full-text article views including HTML views, PDF and ePub downloads, according to the available data) and Abstracts Views on Vision4Press platform.
Data correspond to usage on the plateform after 2015. The current usage metrics is available 48-96 hours after online publication and is updated daily on week days.
Initial download of the metrics may take a while.