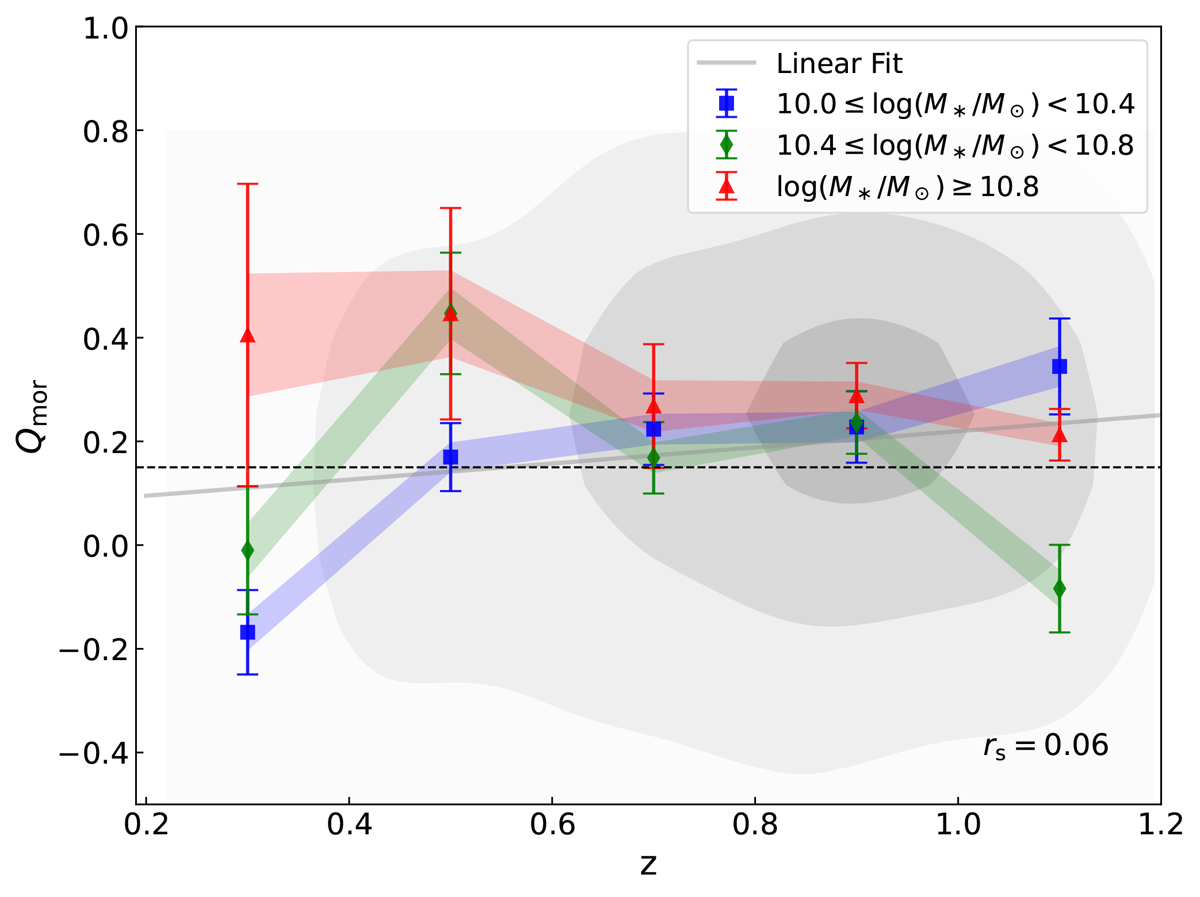
Fig. 7.
Download original image
Evolution of morphological quenching efficiency (Qmor) with the redshift interval Δz = 0.2. Different colors represent the trends in different stellar mass bins. The black dashed line displays the threshold of Qmor = 0.15. The extreme Qmor values within the upper and lower limits of 5% are excluded to reduce the impact of outliers on the error estimate. The correlation error is determined by resampling 1000 times using bootstrapping, where the error is defined as the standard deviation of the distribution of the median values over samples. The shaded areas represent 40% of the error bars. Based on a bootstrap sampling method, the distribution between Qmor and redshift is shown in the grey contours, with the best-fitting line shown in grey. Four iterations with outlier rejection based on a 3σ clipping criterion were applied to improve robustness. The small Spearman’s rank correlation coefficient (rs) indicates the weak relation between Qmor and redshift.
Current usage metrics show cumulative count of Article Views (full-text article views including HTML views, PDF and ePub downloads, according to the available data) and Abstracts Views on Vision4Press platform.
Data correspond to usage on the plateform after 2015. The current usage metrics is available 48-96 hours after online publication and is updated daily on week days.
Initial download of the metrics may take a while.