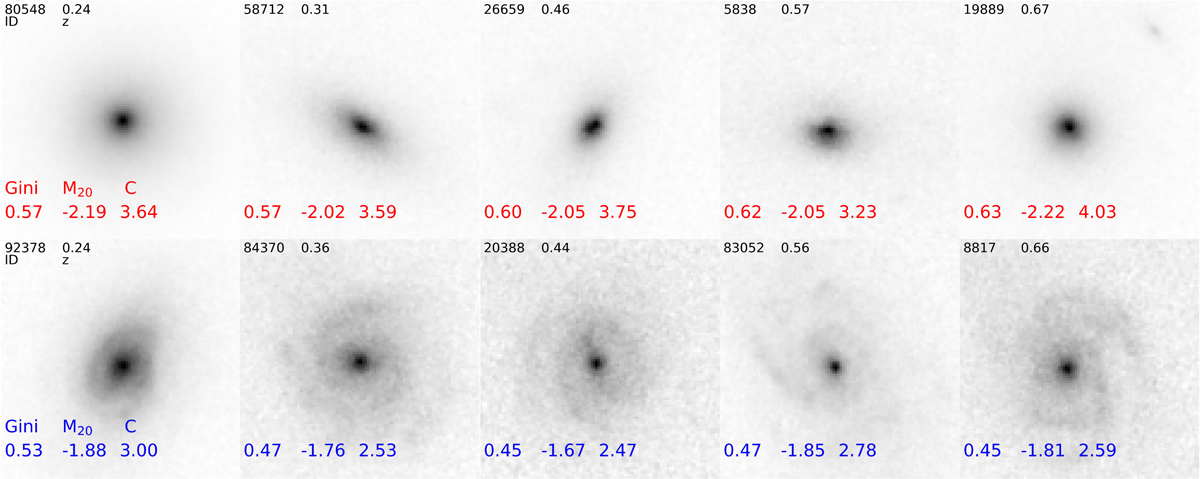
Fig. 4.
Download original image
Example images of ETDs (the first row) and LTDs (the second row) at 0.2 < z < 0.7 in the I band (see Fig. A.1 for example images at 0.7 ≤ z < 1.2). The corresponding information of each ETD (LTD) galaxy is depicted in red (blue) on the image, including the galaxy ID from the COSMOS2020 catalog, photometric redshift, Gini coefficient, M20 index, and the concentration, C.
Current usage metrics show cumulative count of Article Views (full-text article views including HTML views, PDF and ePub downloads, according to the available data) and Abstracts Views on Vision4Press platform.
Data correspond to usage on the plateform after 2015. The current usage metrics is available 48-96 hours after online publication and is updated daily on week days.
Initial download of the metrics may take a while.