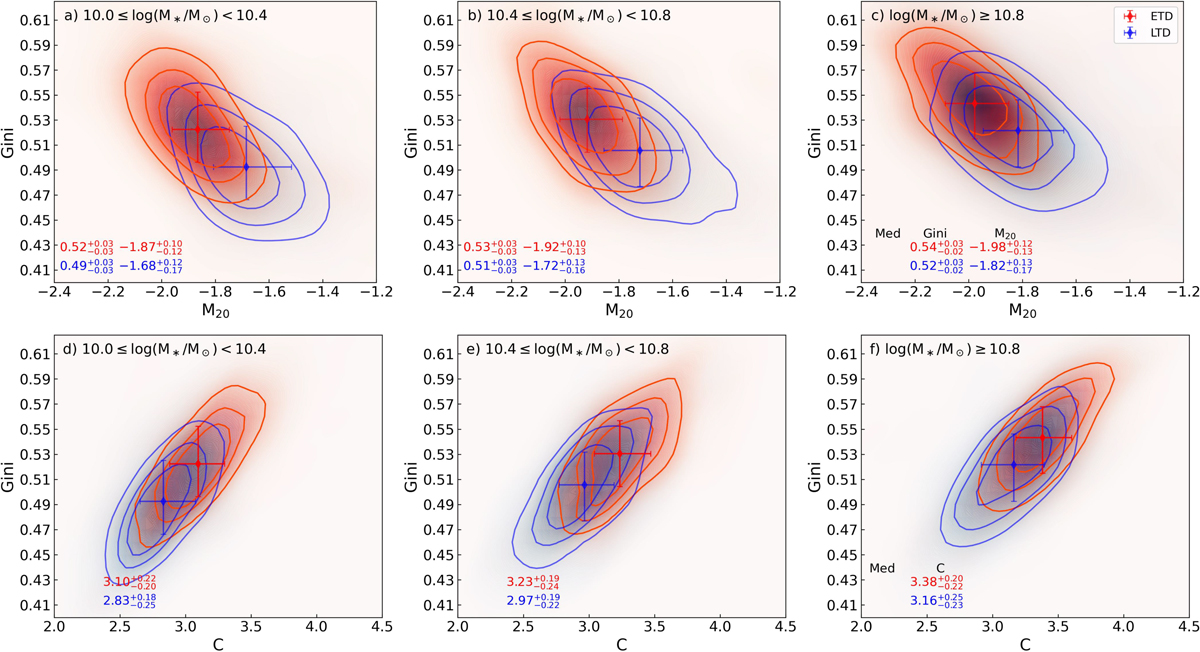
Fig. 3.
Download original image
Distributions of ETDs (red) and LTDs (blue) in the Gini-M20 (top panels) and Gini-C (bottom panels) spaces within three stellar mass bins (left: 10.0 ≤ log(M*/M⊙) < 10.4, middle: 10.4 ≤ log(M*/M⊙) < 10.8, right: log(M*/M⊙)≥10.8). The red (blue) background represents the number density distribution of ETDs (LTDs) in each space. The red (blue) contours enclose 30%, 50%, and 70% of the respective subsamples. The red (blue) diamond indicates the median value of ETDs (LTDs) in each space, with ±25th percentile uncertainties. The corresponding median values and uncertainties are displayed at the bottom of each panel.
Current usage metrics show cumulative count of Article Views (full-text article views including HTML views, PDF and ePub downloads, according to the available data) and Abstracts Views on Vision4Press platform.
Data correspond to usage on the plateform after 2015. The current usage metrics is available 48-96 hours after online publication and is updated daily on week days.
Initial download of the metrics may take a while.