Fig. B.1.
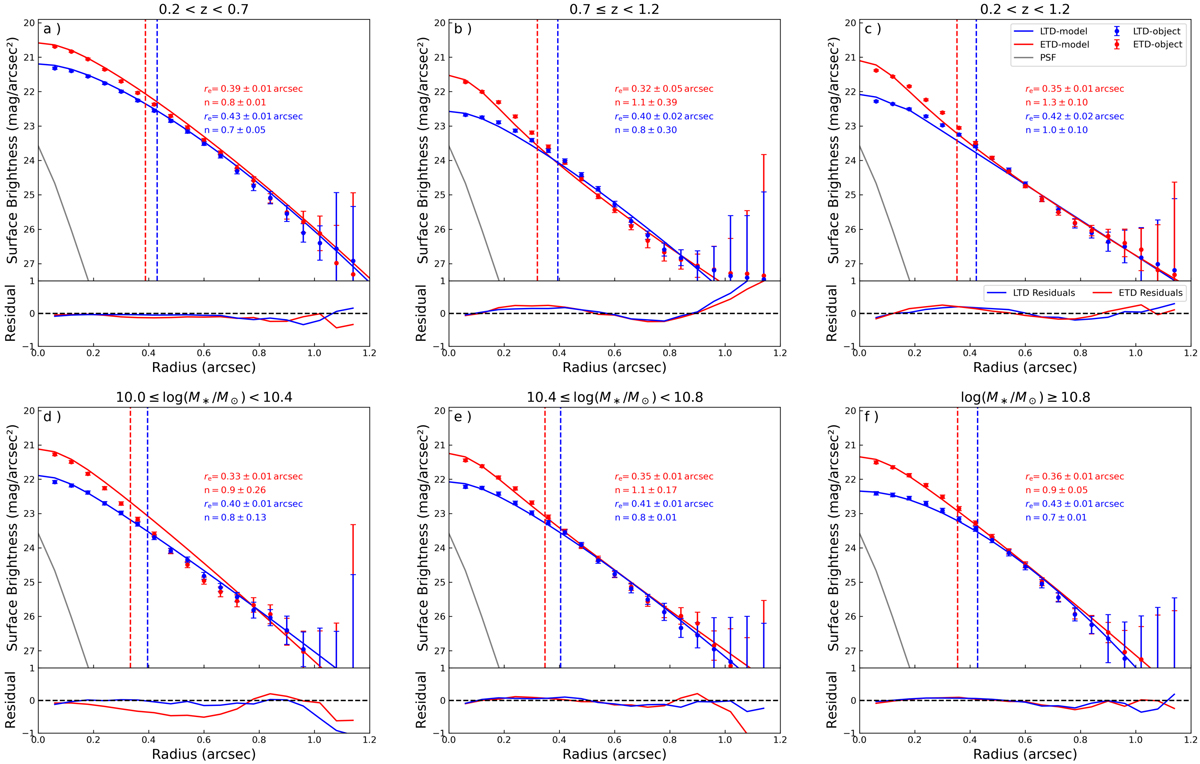
Download original image
Average surface brightness profiles of ETDs (red) and LTDs (blue) in the I band at different redshift intervals (top panels) and stellar mass bins (bottom panels). By fitting the surface brightness distribution of galaxies using iFIT (Breda et al. 2019), the best-fit model profiles are shown in solid lines. The corresponding effective radius, re, (also shown as a vertical dashed line) and the Sérsic index, n, with absolute deviations are obtained and printed at the top right of each panel. The residual between the average surface brightness profiles of observed ETDs (LTDs) and their best-fit model profiles is displayed at the bottom. The PSF distribution is displayed in gray.
Current usage metrics show cumulative count of Article Views (full-text article views including HTML views, PDF and ePub downloads, according to the available data) and Abstracts Views on Vision4Press platform.
Data correspond to usage on the plateform after 2015. The current usage metrics is available 48-96 hours after online publication and is updated daily on week days.
Initial download of the metrics may take a while.