Fig. 11.
Download original image
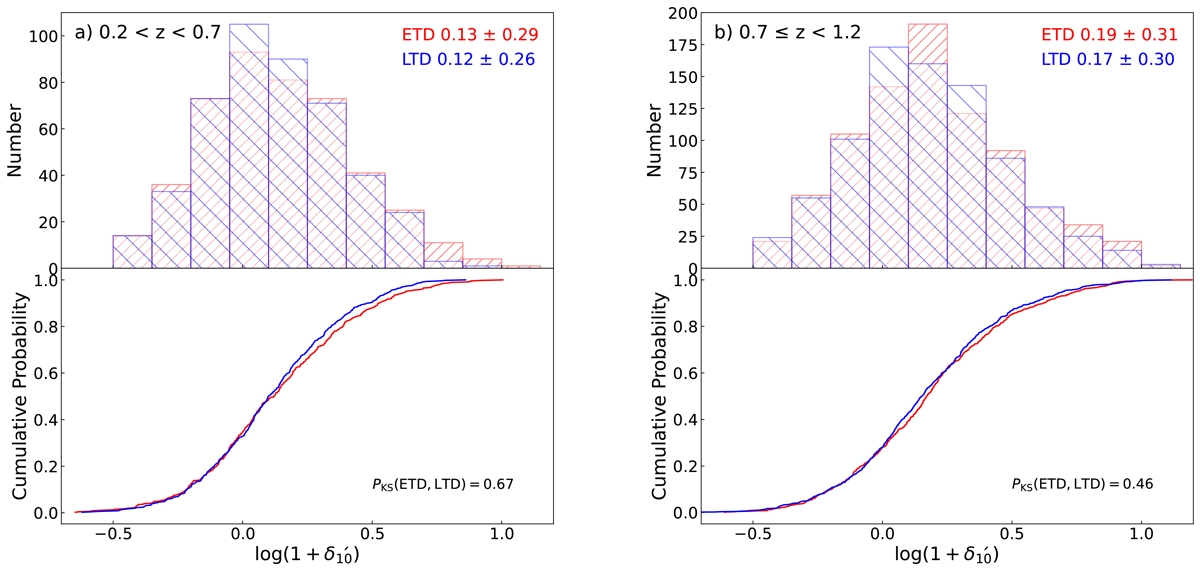
Distributions (top panels) and cumulative probabilities (bottom panels) of overdensity at 0.2 < z < 0.7 (left) and 0.7 ≤ z < 1.2 (right), respectively. The red- and blue-shaded histograms represent ETDs and LTDs, respectively. The corresponding means and standard deviations are provided in the top-right corner of the top panel. The probabilities derived from the K-S tests for the two subsamples are indicated in the lower right corners of the bottom panels.
Current usage metrics show cumulative count of Article Views (full-text article views including HTML views, PDF and ePub downloads, according to the available data) and Abstracts Views on Vision4Press platform.
Data correspond to usage on the plateform after 2015. The current usage metrics is available 48-96 hours after online publication and is updated daily on week days.
Initial download of the metrics may take a while.