Fig. 1.
Download original image
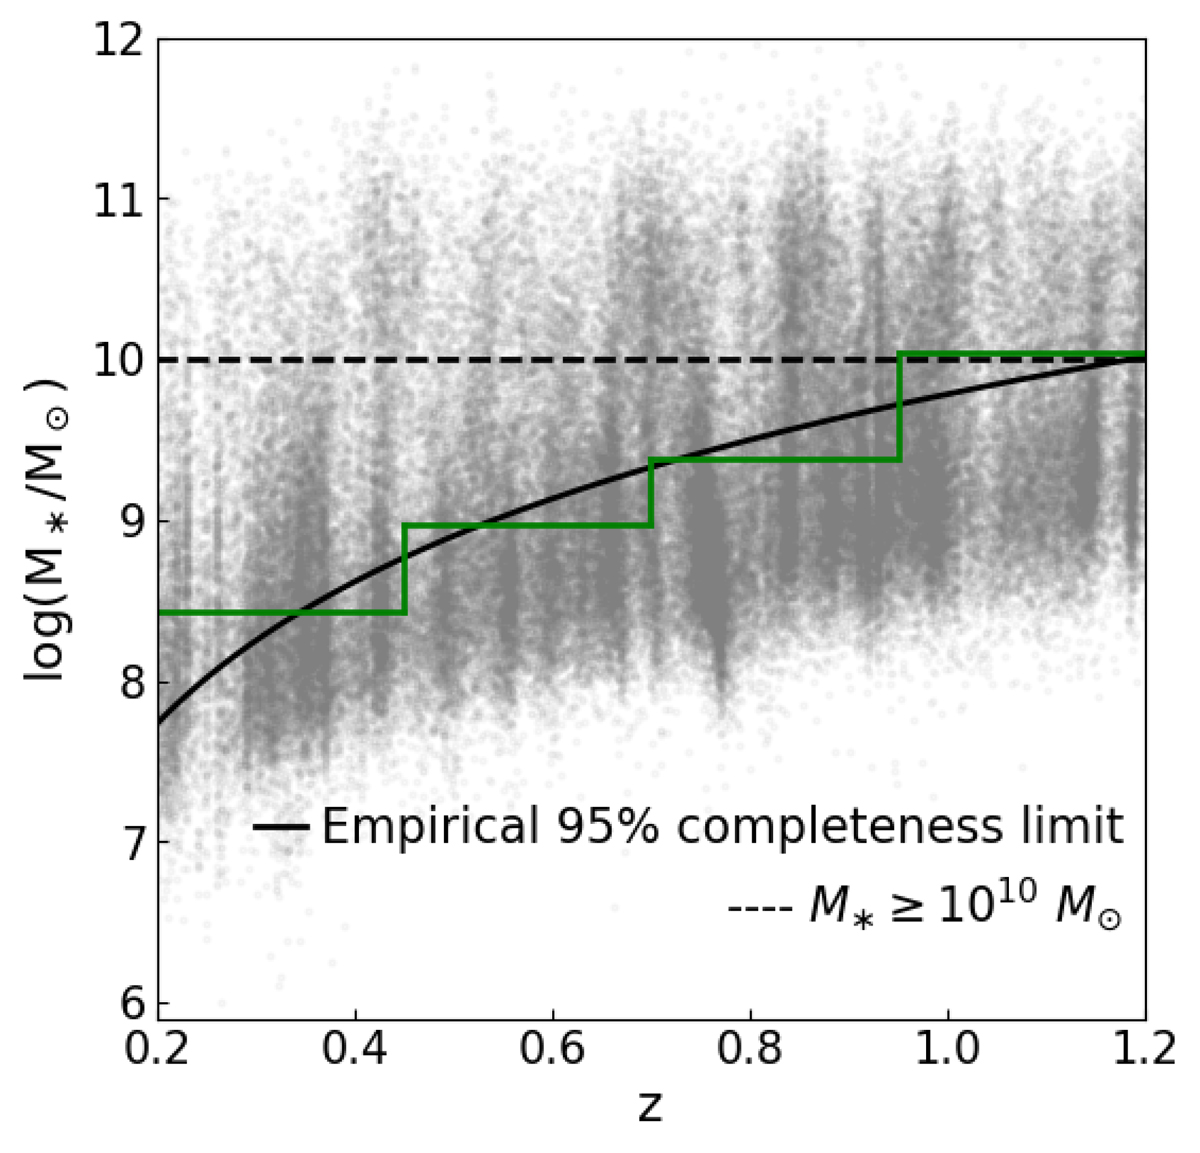
Distribution of stellar mass as a function of redshift. The boundaries of mass completeness in different fixed redshift bins (Δz = 0.25) are shown in green. The solid black line represents the best fitting of boundaries by the parameterized function Mmin(z) = 1.28ln(z)+9.78. The mass threshold (M* = 1010 M⊙) adopted in this work is present in the dashed back line, which could ensure a ≥95% completeness up to z ∼ 1.2. The background gray dots represent the parent sample selected from the COSMOS2020 catalog (see Sect. 2.1).
Current usage metrics show cumulative count of Article Views (full-text article views including HTML views, PDF and ePub downloads, according to the available data) and Abstracts Views on Vision4Press platform.
Data correspond to usage on the plateform after 2015. The current usage metrics is available 48-96 hours after online publication and is updated daily on week days.
Initial download of the metrics may take a while.