Fig. 7
Download original image
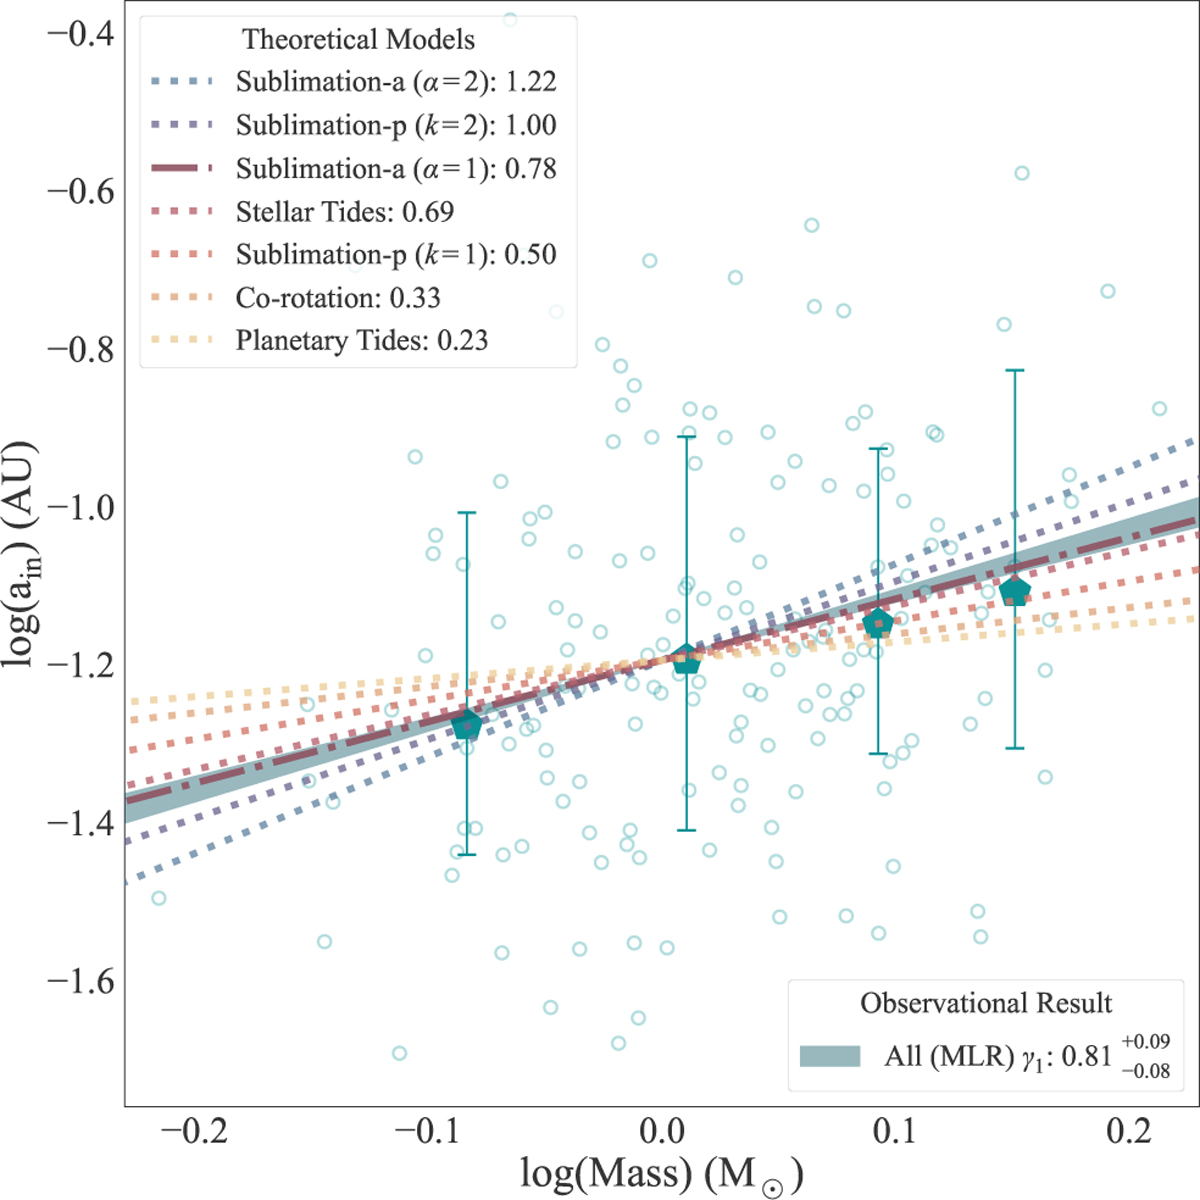
Correlation γ1 comparison between different theoretical models and the observational result. The green band represents the result of the dataset’s all multiple systems population obtained through the MLR model (same as the top panel in Fig. 5, with points having the same meaning). The dotted and dotted-dashed lines in different colors represent the power-law indices under various theoretical models, arranged in descending order from top to bottom. For comparison of correlation γ1 , the intercepts of the models are standardized with the intercept of the observational result.
Current usage metrics show cumulative count of Article Views (full-text article views including HTML views, PDF and ePub downloads, according to the available data) and Abstracts Views on Vision4Press platform.
Data correspond to usage on the plateform after 2015. The current usage metrics is available 48-96 hours after online publication and is updated daily on week days.
Initial download of the metrics may take a while.