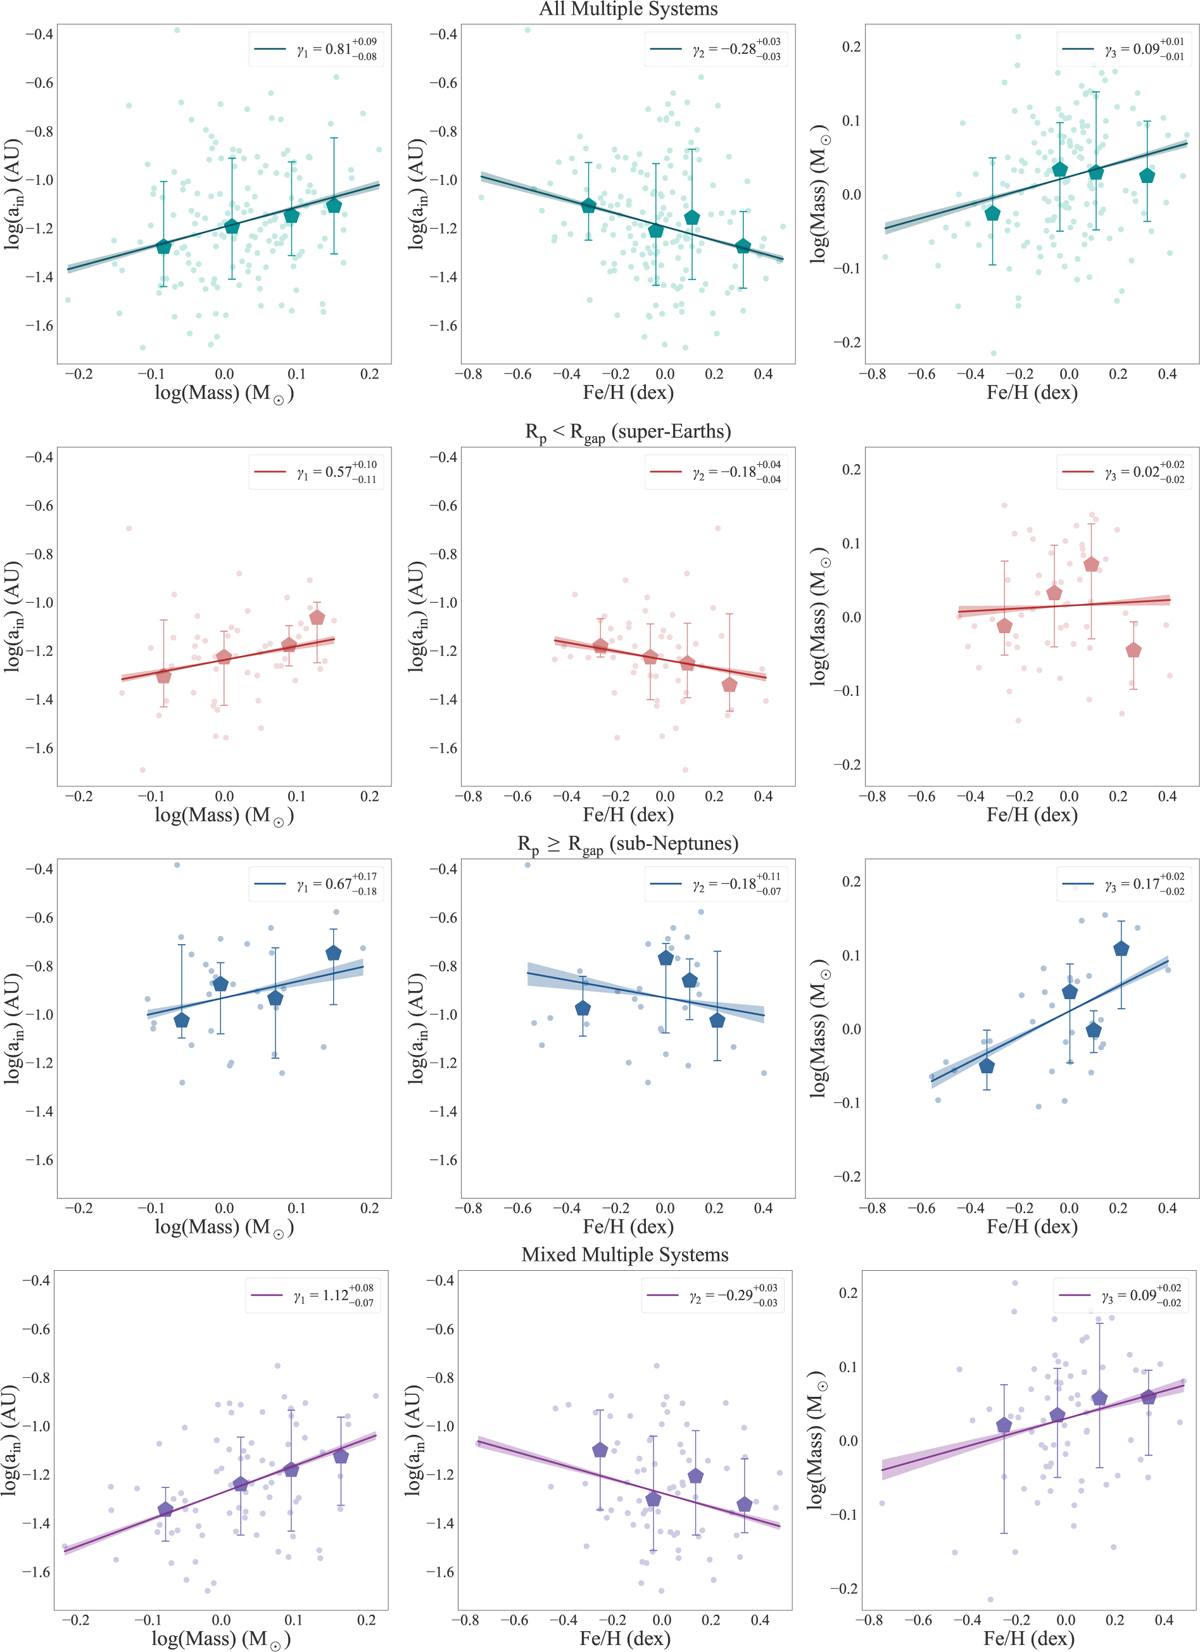
Fig. 5
Download original image
Dependence of the inner edge on stellar mass and metallicity as well as the corresponding dependence between mass and metallicity obtained through the MLR model. The left and middle panels show the power-law indices, which correspond to γ1 and γ2 in Eqs. (7) and (8), respectively. Additionally, the right panels show the power-law index corresponding to γ3 in Eq. (9). The lines represent the fitting results, with color bands indicating 1σ error bars. The colors and styles of points and lines are consistent with those in Fig. 3. Note: The median values and 1σ dispersion of the binned data in this study are calculated in logarithmic space and are based on actual observational data.
Current usage metrics show cumulative count of Article Views (full-text article views including HTML views, PDF and ePub downloads, according to the available data) and Abstracts Views on Vision4Press platform.
Data correspond to usage on the plateform after 2015. The current usage metrics is available 48-96 hours after online publication and is updated daily on week days.
Initial download of the metrics may take a while.