Fig. 3
Download original image
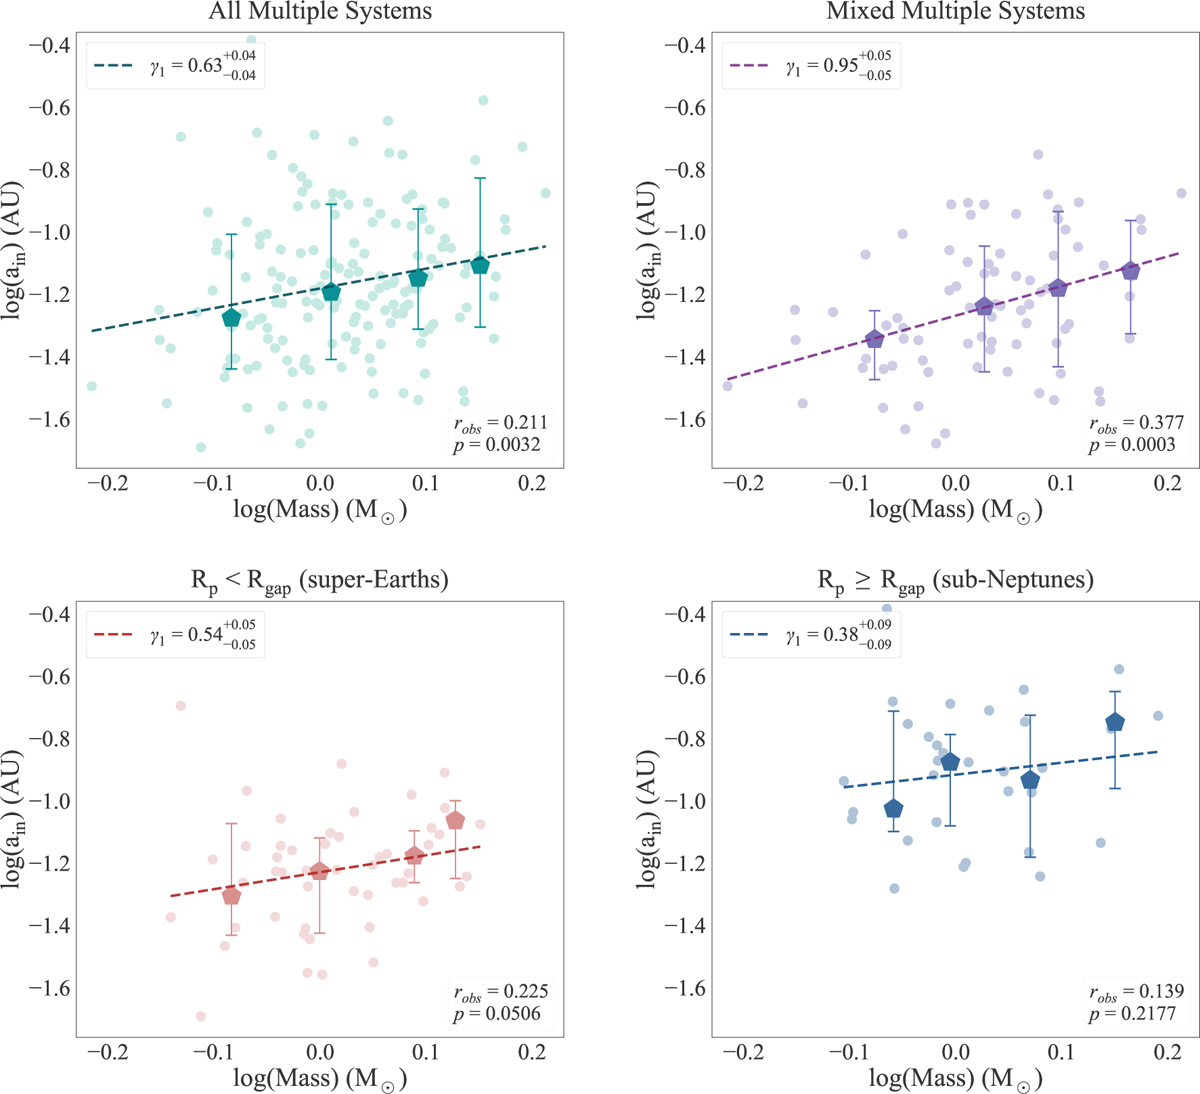
The inner edge of planetary systems as a function of stellar mass for the datasets of all multiple systems, super-Earth systems, sub-Neptune systems, and mixed multiple systems. The four panels illustrate the correlation between the inner edge and stellar mass for different populations. Different colors are used to represent each population: green for all multiple systems, red for super-Earth systems, blue for sub-Neptune systems, and purple for mixed multiple systems. Points represent the observational data, while pentagons indicate the median value for each bin, with error bars showing 1σ. In this work, the binning is merely intended to guide the eye. Dashed lines represent the fit to the observational data based on Eq. (3). The power-law index corresponds to γ1 in Eqs. (2) and (3), with error bars also indicating 1σ. robs and p represent the Pearson coefficients and p-values for the four populations, respectively. Note: The median values and 1σ dispersion of the binned data in this study are calculated in logarithmic space and are based on actual observational data.
Current usage metrics show cumulative count of Article Views (full-text article views including HTML views, PDF and ePub downloads, according to the available data) and Abstracts Views on Vision4Press platform.
Data correspond to usage on the plateform after 2015. The current usage metrics is available 48-96 hours after online publication and is updated daily on week days.
Initial download of the metrics may take a while.