Fig. 1
Download original image
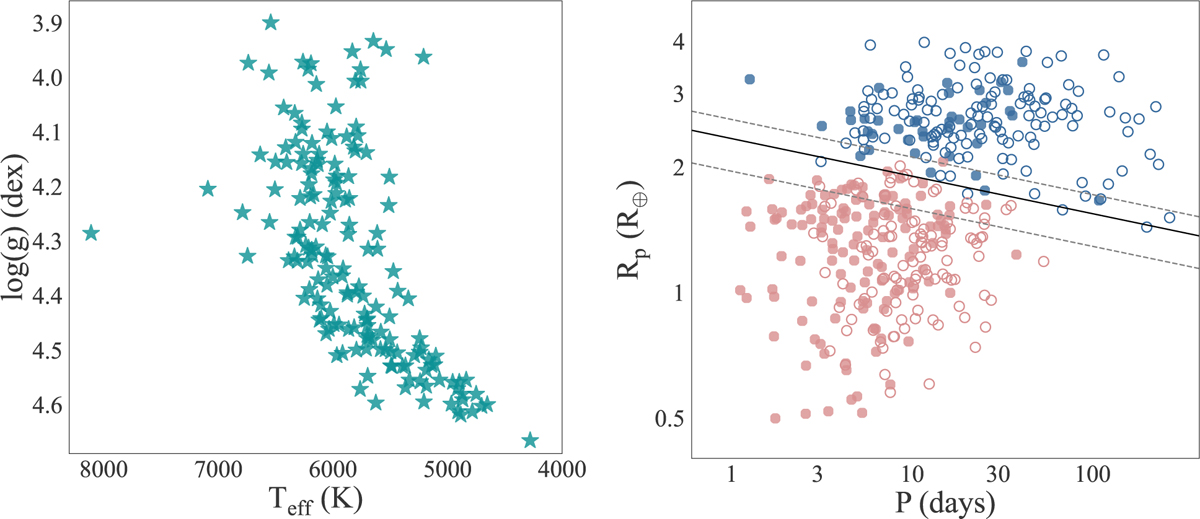
Distribution of stars and planets for all multis studied in this paper. The left panel illustrates the distribution of stars, while the right panel presents the distribution of planets. Solid points denote the inner edge of the system, while hollow points represent other planets within the system. Red points indicate super-Earths and blue points represent sub-Neptunes, classified according to the radius valley defined in Eq. (1). The black solid line indicates M★ = 1.0M⊙, and the upper and lower dashed lines correspond to M★ = 1.5 M⊙ and M★ = 0.5 M⊙, respectively.
Current usage metrics show cumulative count of Article Views (full-text article views including HTML views, PDF and ePub downloads, according to the available data) and Abstracts Views on Vision4Press platform.
Data correspond to usage on the plateform after 2015. The current usage metrics is available 48-96 hours after online publication and is updated daily on week days.
Initial download of the metrics may take a while.