Fig. 7
Download original image
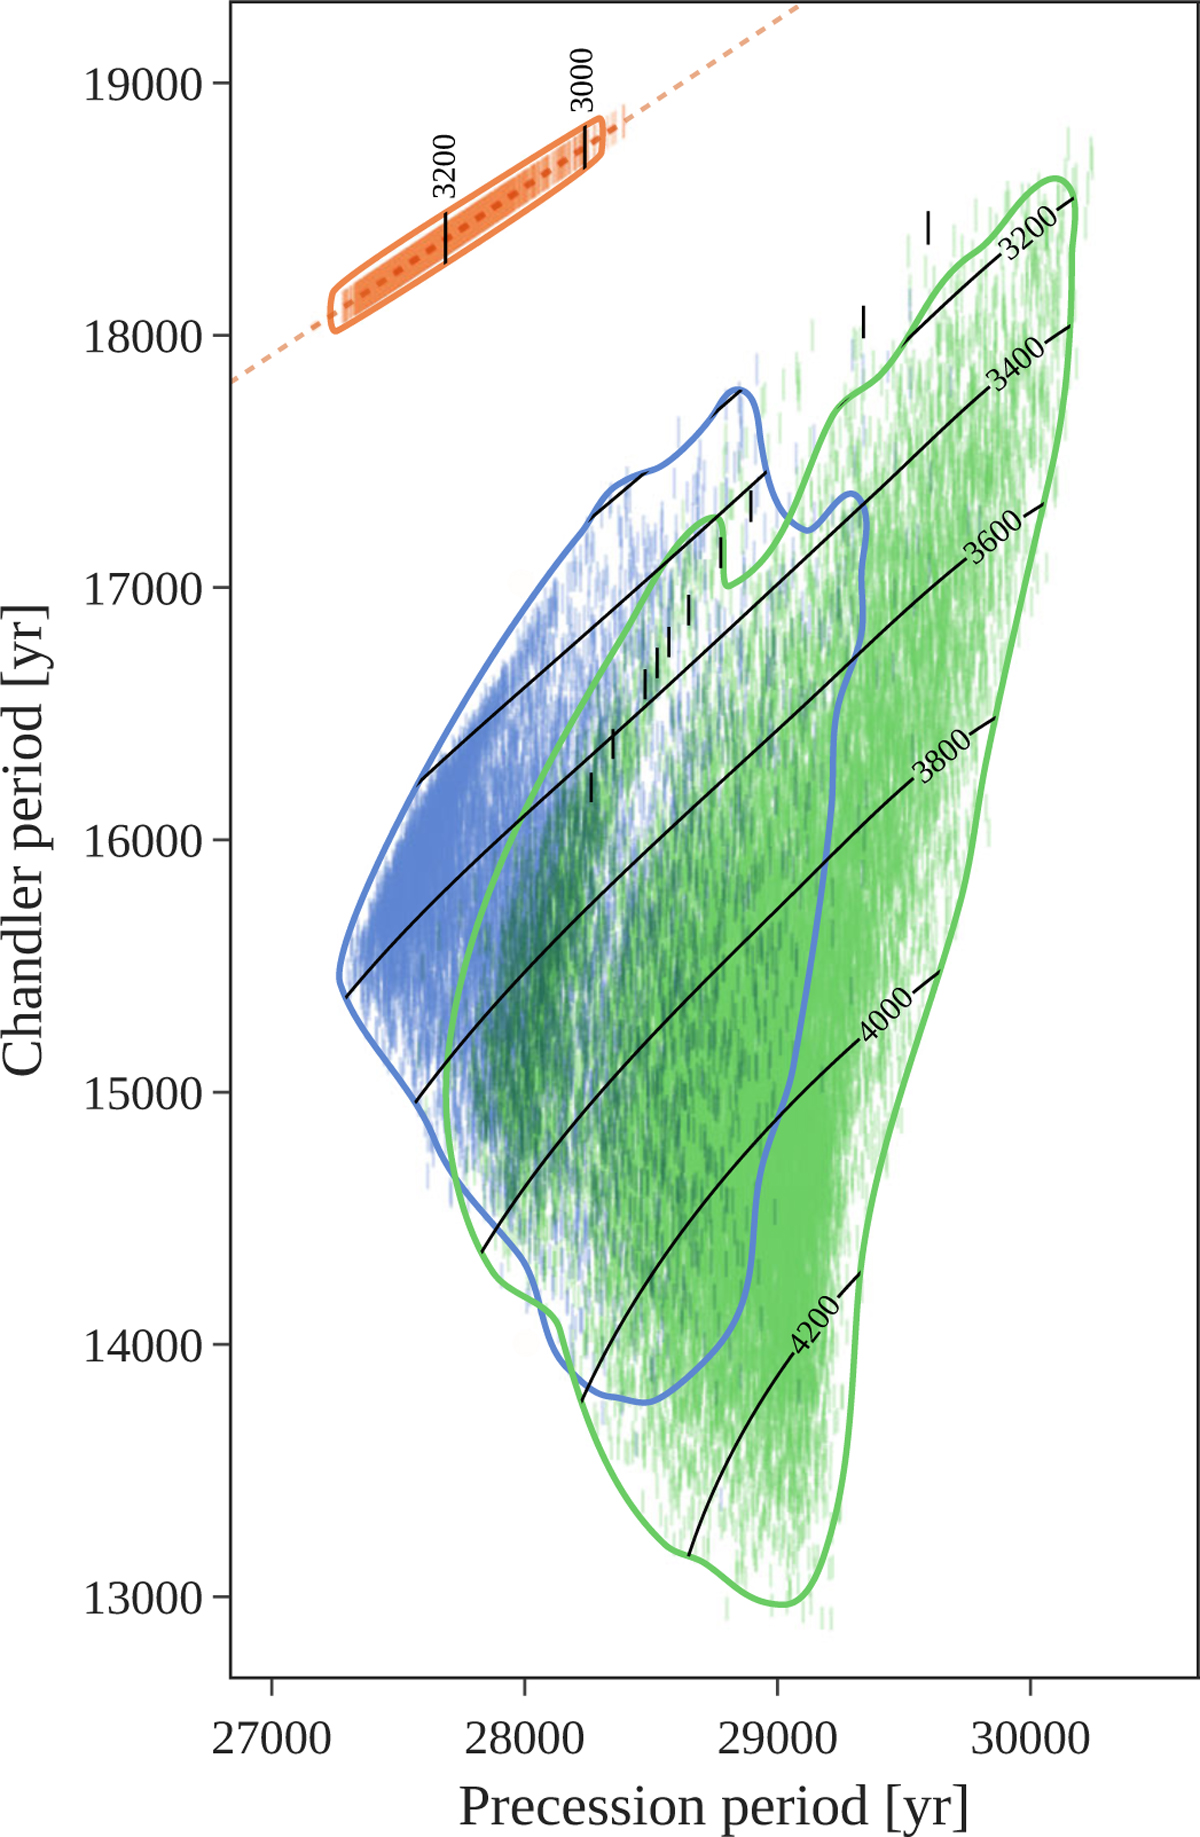
Chandler and precession periods of Venus computed for the density profiles of Shah et al. (2022), featuring either a fully liquid core (green), a solid inner core with a liquid outer core (blue), or a fully solid core (orange). For each core state, the 99% contour of a kernel density estimate is shown. Black bars correspond to the density profiles from Dumoulin et al. (2017), all featuring fully liquid cores. Black level lines indicate the core size of the models in kilometers, to within 50 km.
Current usage metrics show cumulative count of Article Views (full-text article views including HTML views, PDF and ePub downloads, according to the available data) and Abstracts Views on Vision4Press platform.
Data correspond to usage on the plateform after 2015. The current usage metrics is available 48-96 hours after online publication and is updated daily on week days.
Initial download of the metrics may take a while.