Fig. 5
Download original image
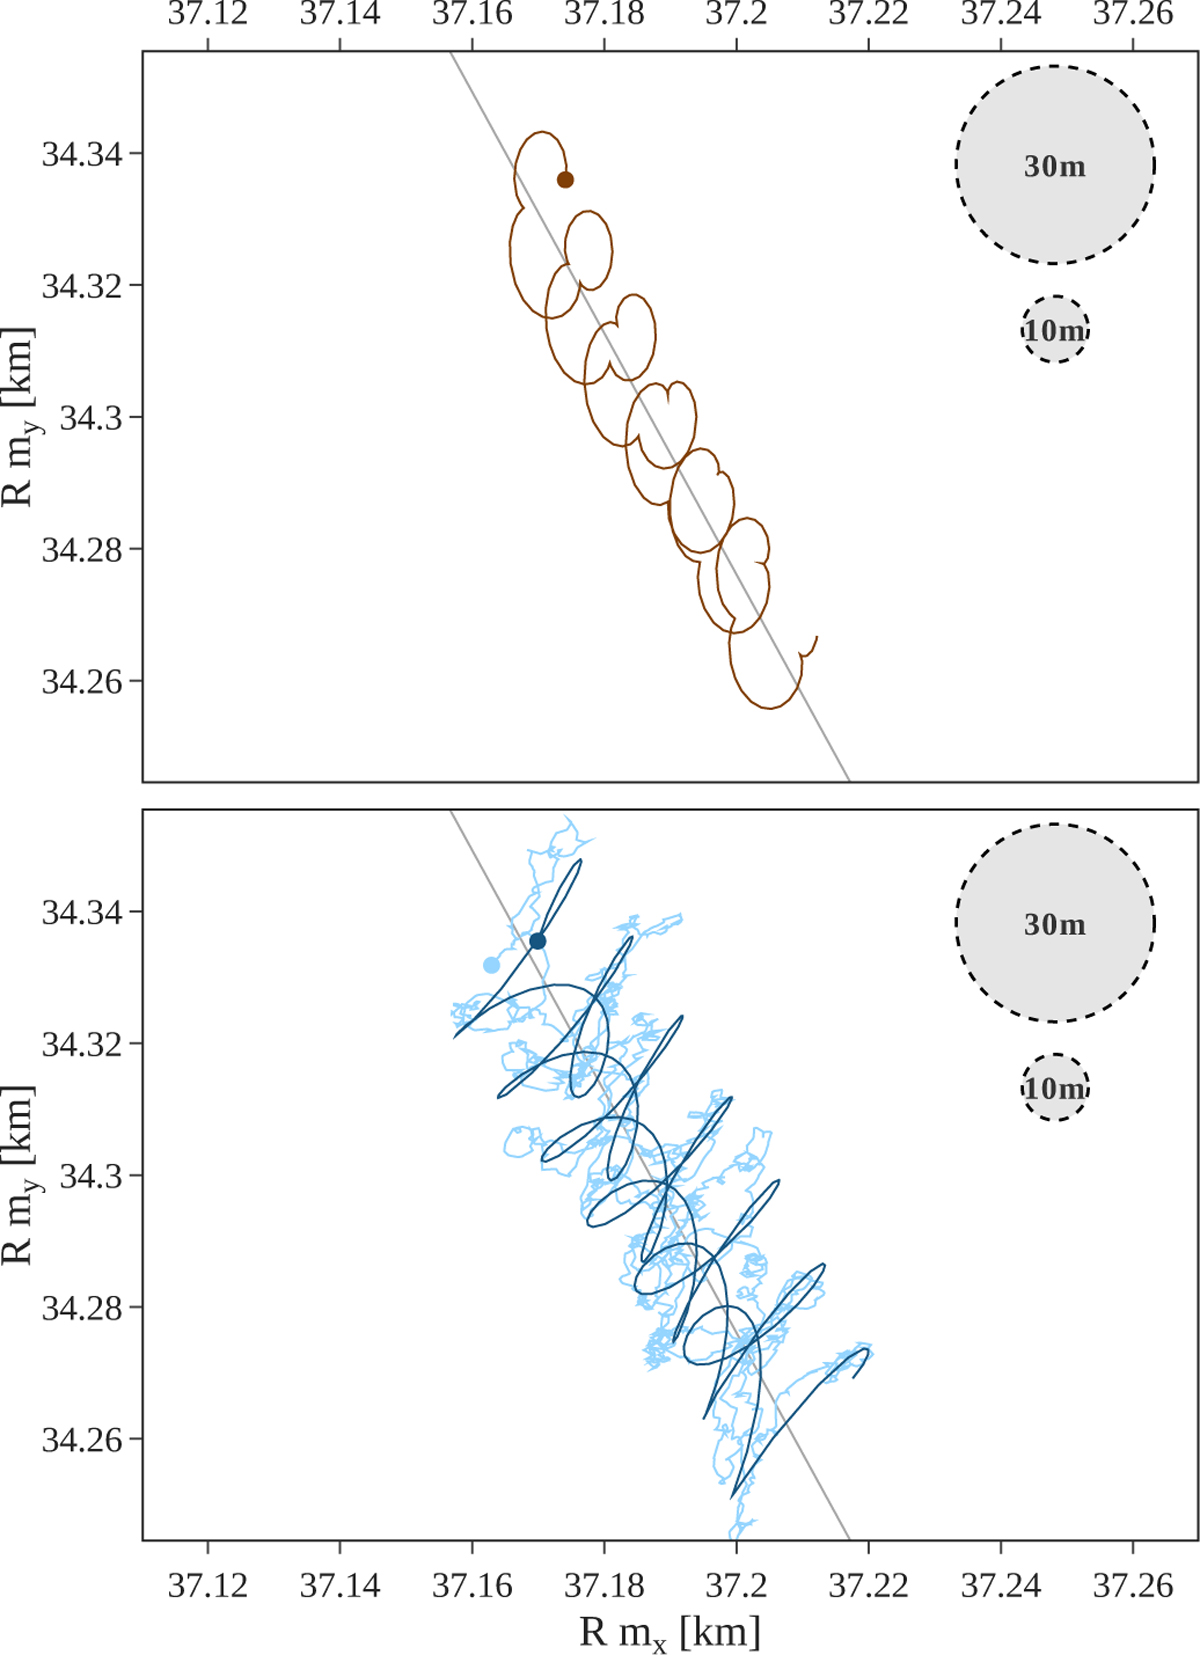
Path of Venus’s spin pole in the BRF over 4 years (2034-2038). The gray line represents the free wobble, appearing as a linear trend at this scale. Colored curves show the polar motion caused by: the solar torque only (top panel), the solar torque and the atmosphere (bottom panel, light blue), the solar torque and just the 117-day atmospheric contribution (bottom panel, dark blue, added for readability). Initial positions are indicated with dots. For reference, the surface resolution of EnVision’s VenSAR is indicated, for the regional (30 m) and targeted (10m) imaging.
Current usage metrics show cumulative count of Article Views (full-text article views including HTML views, PDF and ePub downloads, according to the available data) and Abstracts Views on Vision4Press platform.
Data correspond to usage on the plateform after 2015. The current usage metrics is available 48-96 hours after online publication and is updated daily on week days.
Initial download of the metrics may take a while.