Fig. 3
Download original image
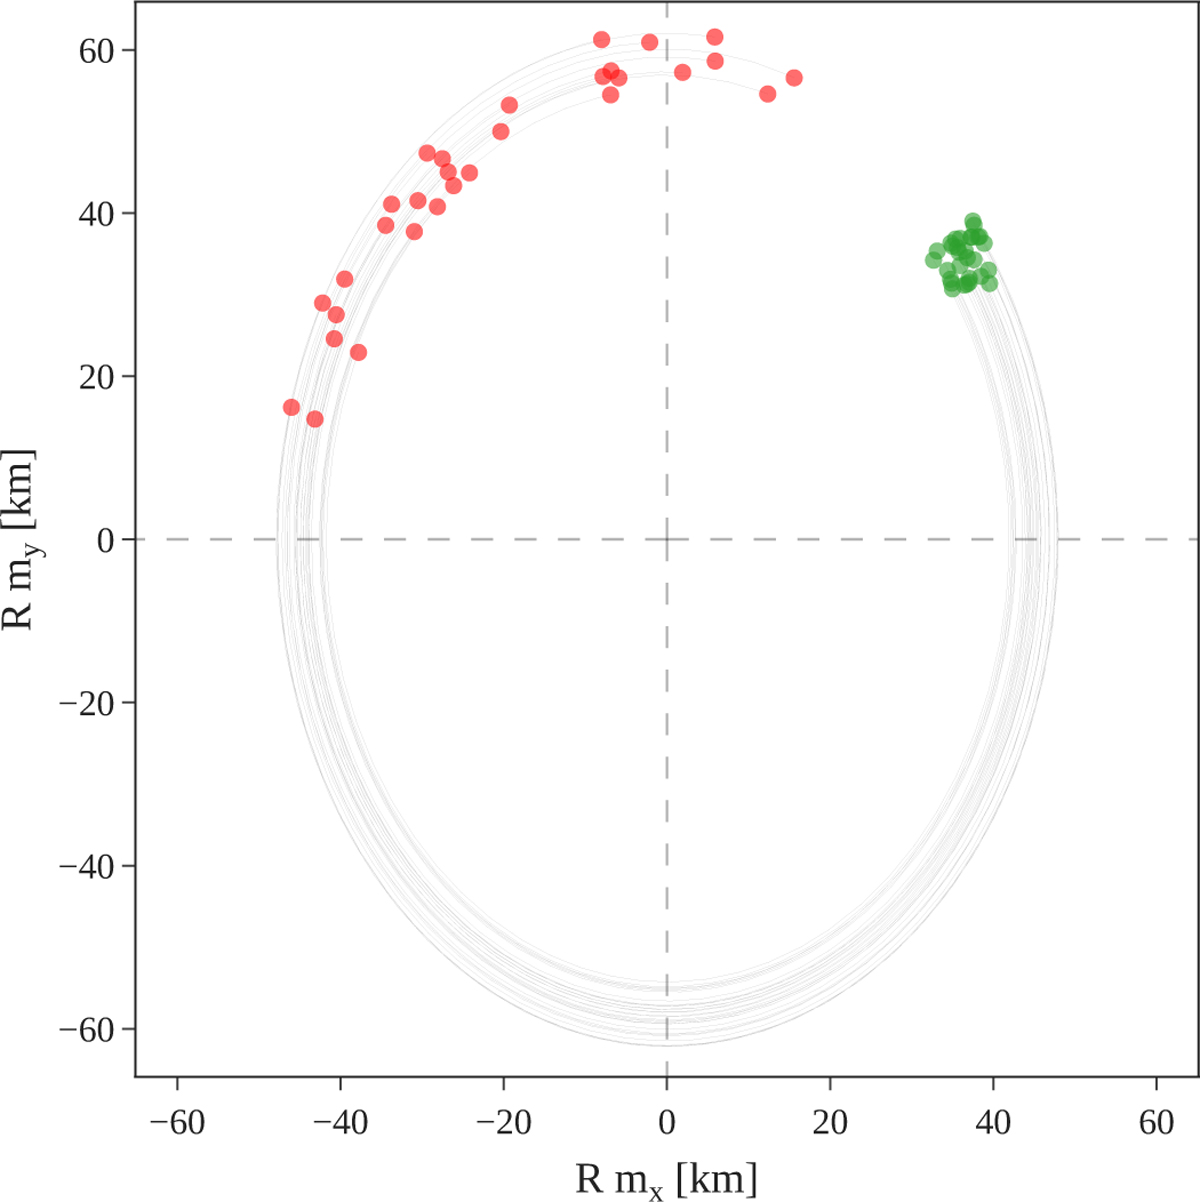
Possible paths of Venus’s spin pole in the BRF over 12 000 years, showing less than one period of the Chandler wobble. The motion corresponds to Eq. (40) for a liquid outer core. The thirty green dots show possible initial positions of the pole at epoch J2000. The red dots show the positions after 12 000 years, their spread reflecting the Chandler period range from Eq. (42). Fluctuations due to high-frequency forcing are too small to be seen at this scale (see Fig. 5).
Current usage metrics show cumulative count of Article Views (full-text article views including HTML views, PDF and ePub downloads, according to the available data) and Abstracts Views on Vision4Press platform.
Data correspond to usage on the plateform after 2015. The current usage metrics is available 48-96 hours after online publication and is updated daily on week days.
Initial download of the metrics may take a while.