Fig. 2
Download original image
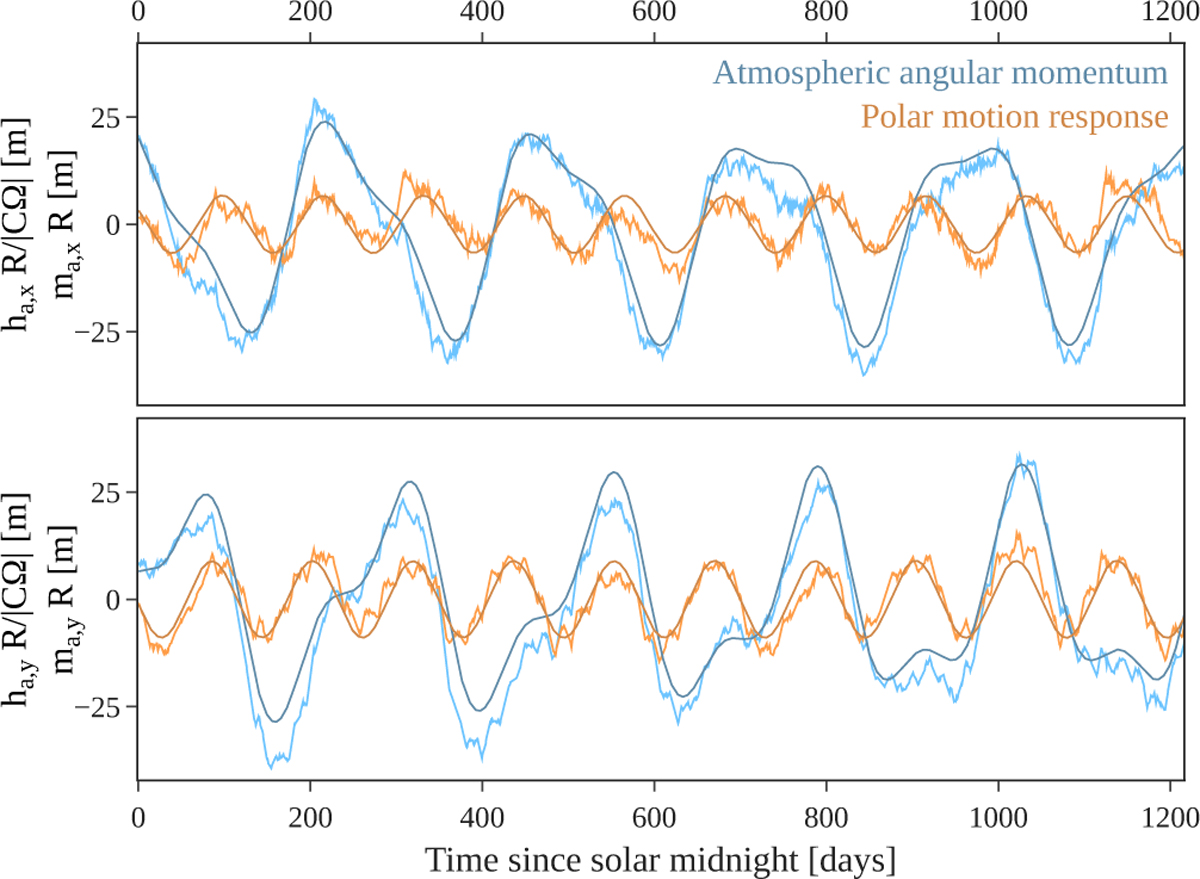
X and Y equatorial components of the atmospheric relative angular momentum (Δha, blue) and of the polar motion it induces on the solid body (ma, orange). The angular momentum is normalized by |CΩ| which is the transfer function for high frequencies. Bright lines show the numerical time series for the Δha, with ma computed through a Discrete Fourier Transform. Darker lines show the quasi-periodic approximation for Δha with only the first three components of Table 2, with ma computed analytically. The time axis is in Earth days.
Current usage metrics show cumulative count of Article Views (full-text article views including HTML views, PDF and ePub downloads, according to the available data) and Abstracts Views on Vision4Press platform.
Data correspond to usage on the plateform after 2015. The current usage metrics is available 48-96 hours after online publication and is updated daily on week days.
Initial download of the metrics may take a while.