Fig. 8
Download original image
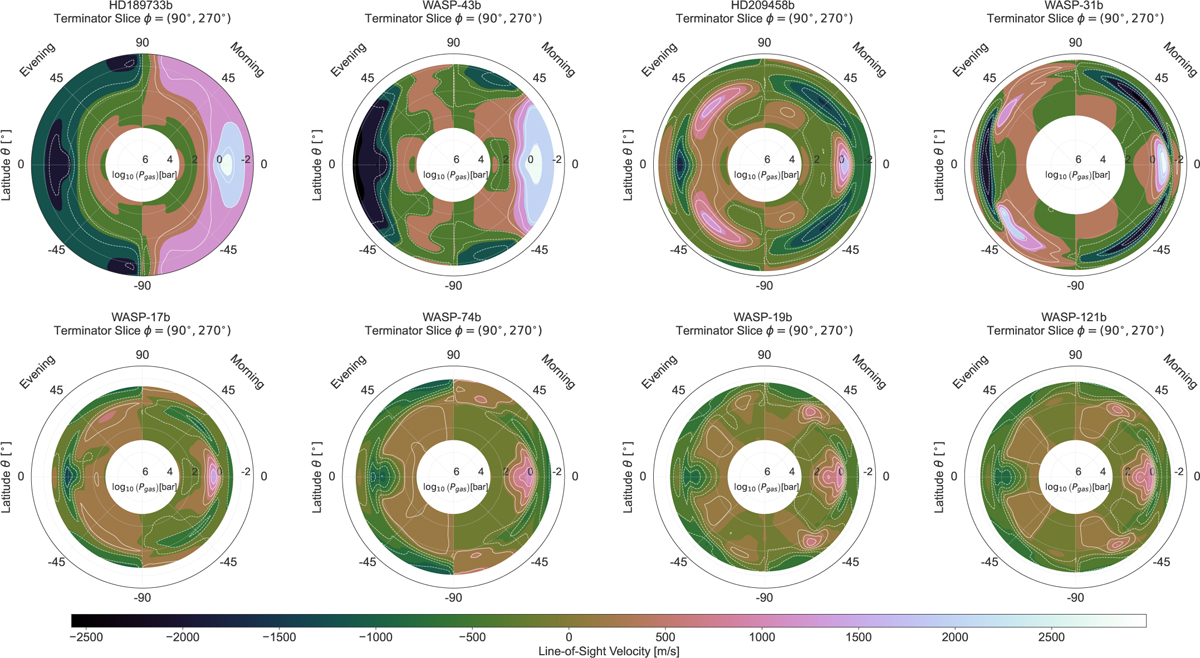
Line-of-sight velocities presented across a slice along the terminator. Equilibrium temperatures increase from the coldest hot Jupiter case in our sample HD 189733b on the upper left corner to the hottest hot Jupiter example in our sample WASP-121b on the bottom right corner. Positive values denote winds moving away from the observer, and the effect of planetary rotation is not taken into account. For guidance in reading this plot, please refer to Figure 1.
Current usage metrics show cumulative count of Article Views (full-text article views including HTML views, PDF and ePub downloads, according to the available data) and Abstracts Views on Vision4Press platform.
Data correspond to usage on the plateform after 2015. The current usage metrics is available 48-96 hours after online publication and is updated daily on week days.
Initial download of the metrics may take a while.