Fig. 6
Download original image
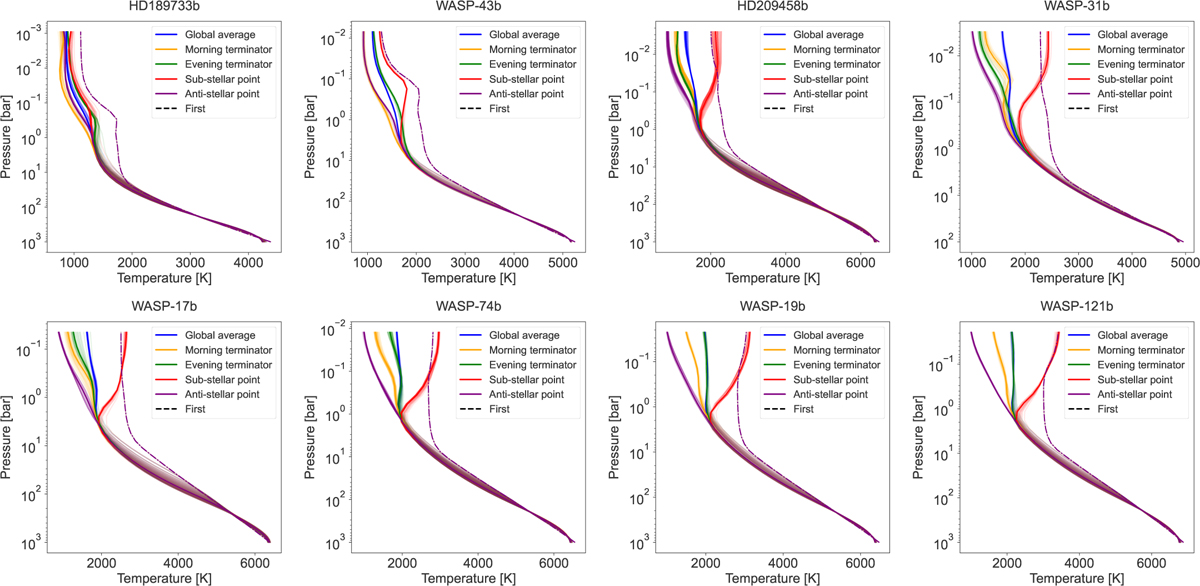
T - P profiles from simulations of the eight hot Jupiters in our GCM sample, including that of the morning terminator, evening terminator, SS point and AS point. Also shown is the globally averaged profile. The initial temperature-pressure profile is shown as a dot-dashed curve. Each curve is accompanied by a shaded region that shows the temporal evolution of each profile, where the first 500 days of spin-up have been excluded.
Current usage metrics show cumulative count of Article Views (full-text article views including HTML views, PDF and ePub downloads, according to the available data) and Abstracts Views on Vision4Press platform.
Data correspond to usage on the plateform after 2015. The current usage metrics is available 48-96 hours after online publication and is updated daily on week days.
Initial download of the metrics may take a while.