Fig. 3
Download original image
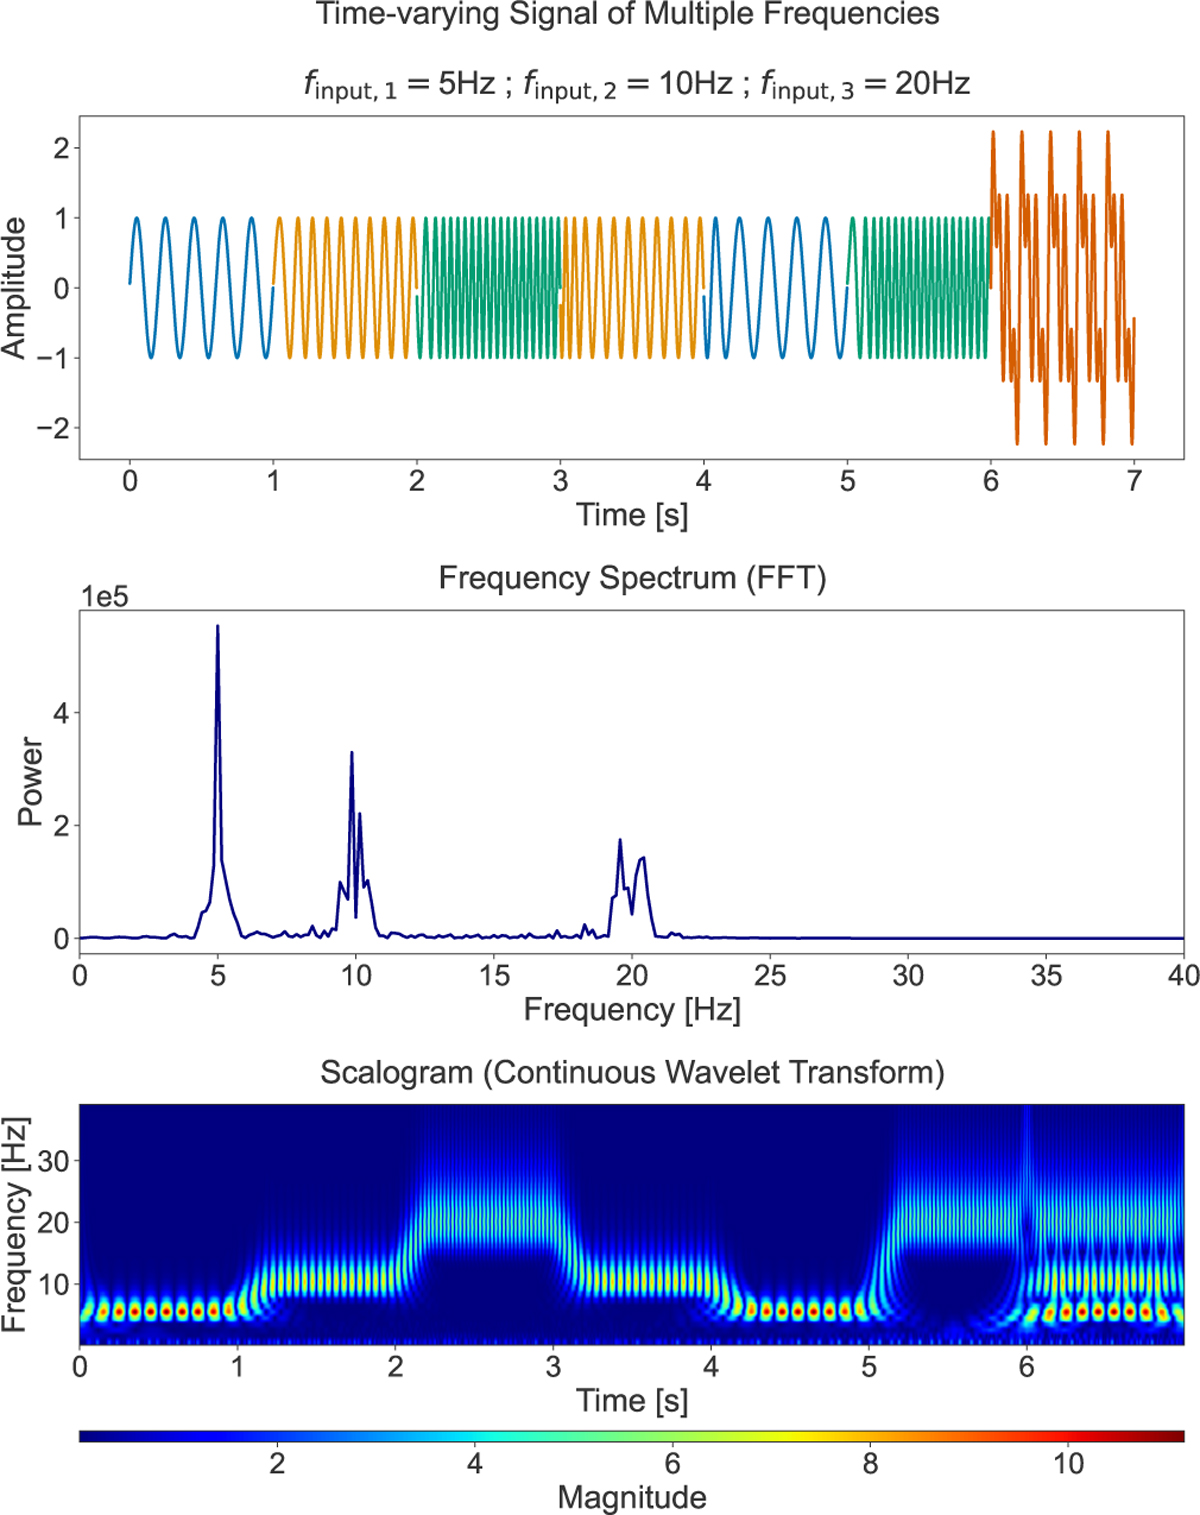
Simple comparison illustrating the differences between a Fourier transform (middle panel) and a CWT (bottom panel). Top: simple timevarying sinusoidal signal composed of successive pure sine waves at different frequencies, culminating in the final second where all three frequencies overlap. Signals of the same frequency have the same color. Middle: fast Fourier transform power spectrum of the signal, providing a single, time-averaged frequency-domain view. Bottom: continuous wavelet transformation scalogram of the same signal, showing how the power at each frequency component changes over time.
Current usage metrics show cumulative count of Article Views (full-text article views including HTML views, PDF and ePub downloads, according to the available data) and Abstracts Views on Vision4Press platform.
Data correspond to usage on the plateform after 2015. The current usage metrics is available 48-96 hours after online publication and is updated daily on week days.
Initial download of the metrics may take a while.