Fig. A.2
Download original image
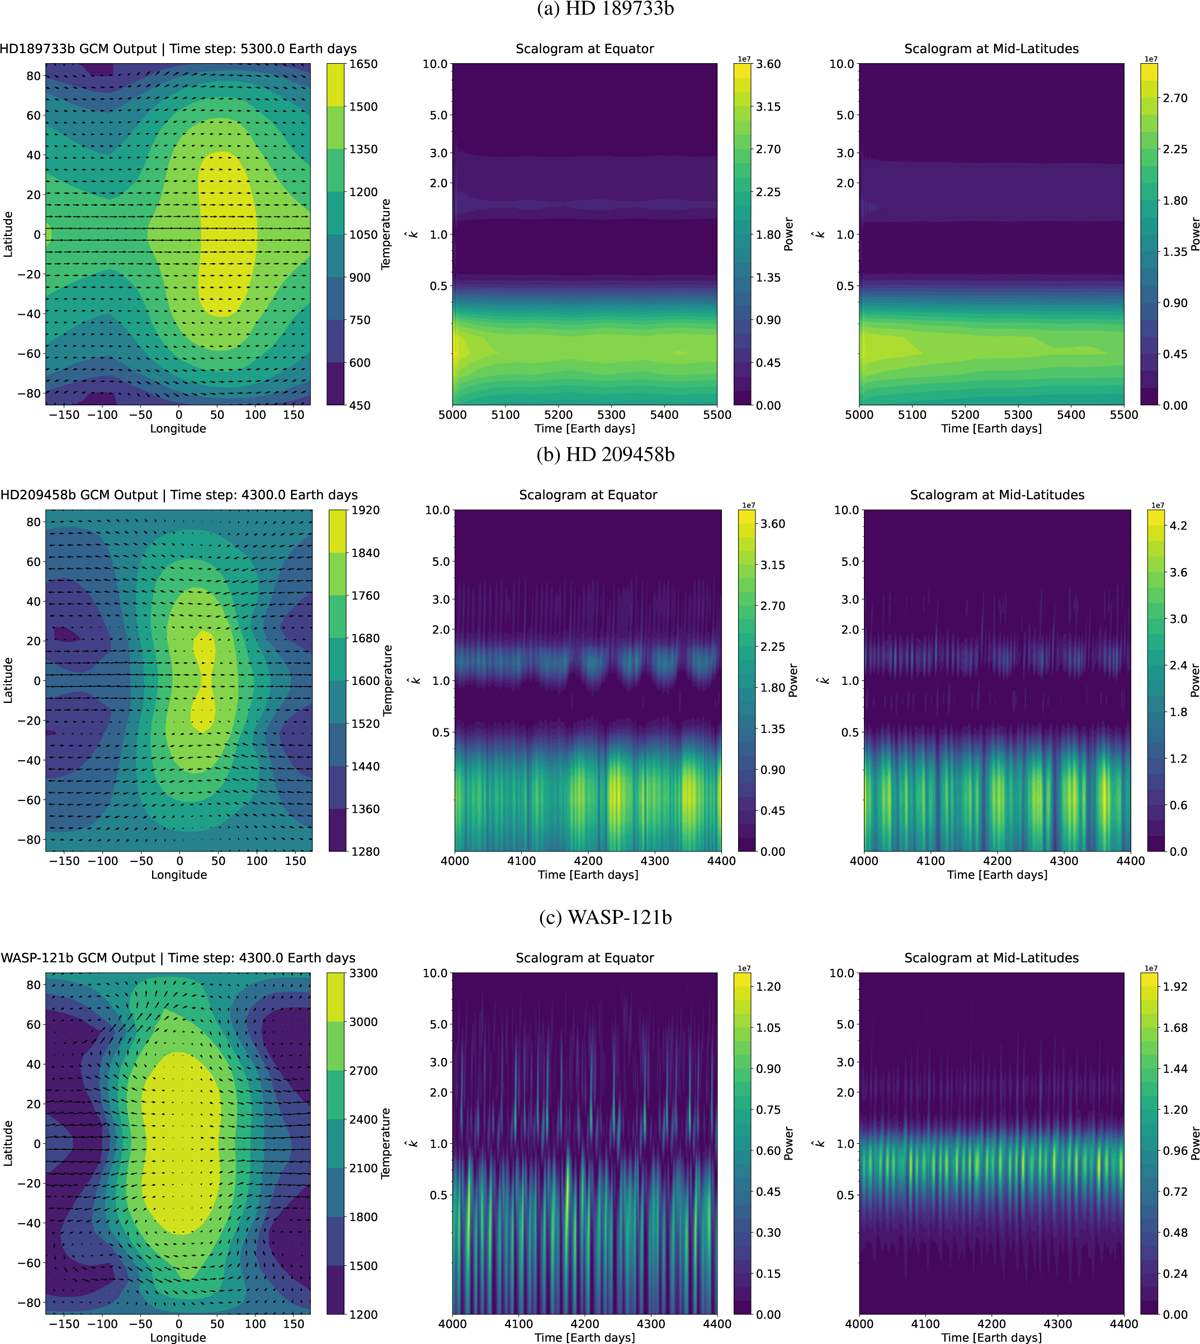
Left panel: Snapshot of the GCM solutions for HD 189733b, HD 209458b, and WASP-121b at 300 days after the full simulation time (≈4000-5000 days), showing temperature and wind fields at the approximate 0.1 bar atmospheric layer. Center & Right: Wavelet scalograms of the zonal wind field at the equator and midlatitudes, respectively.
Current usage metrics show cumulative count of Article Views (full-text article views including HTML views, PDF and ePub downloads, according to the available data) and Abstracts Views on Vision4Press platform.
Data correspond to usage on the plateform after 2015. The current usage metrics is available 48-96 hours after online publication and is updated daily on week days.
Initial download of the metrics may take a while.