Fig. 2
Download original image
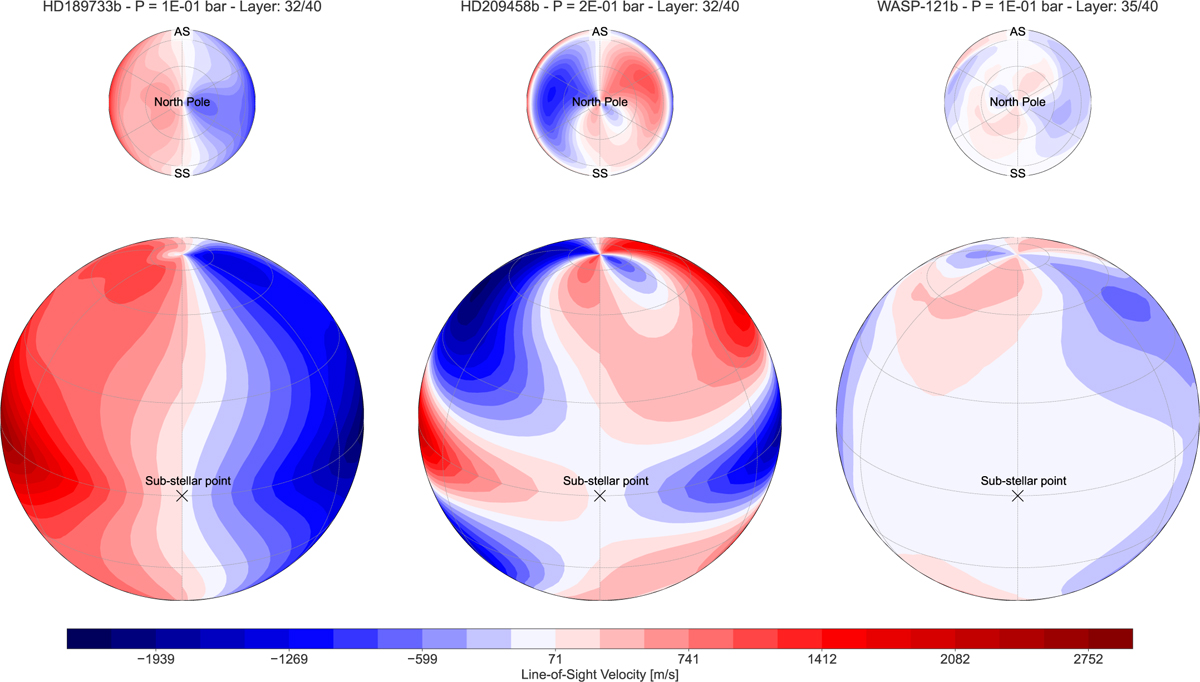
Three-dimensional simulation outputs for three of the eight hot Jupiters in this study. From left to right, the panels showcase (1) a zonal jet-dominated flow, (2) an intermediate transitional regime, and (3) a day-to-night flow pattern. Each column plots the line-of-sight velocity at the P ≈ 0.1 bar atmospheric layer for a single planet. Negative values (blue) denote winds moving toward the observer, while positive values (red) denote winds moving away. The results shown are time-averaged over the last 500 days of their corresponding simulation times. Top: view from the north pole with the SS point and AS point marked. Bottom: view from the dayside.
Current usage metrics show cumulative count of Article Views (full-text article views including HTML views, PDF and ePub downloads, according to the available data) and Abstracts Views on Vision4Press platform.
Data correspond to usage on the plateform after 2015. The current usage metrics is available 48-96 hours after online publication and is updated daily on week days.
Initial download of the metrics may take a while.