Fig. 9.
Download original image
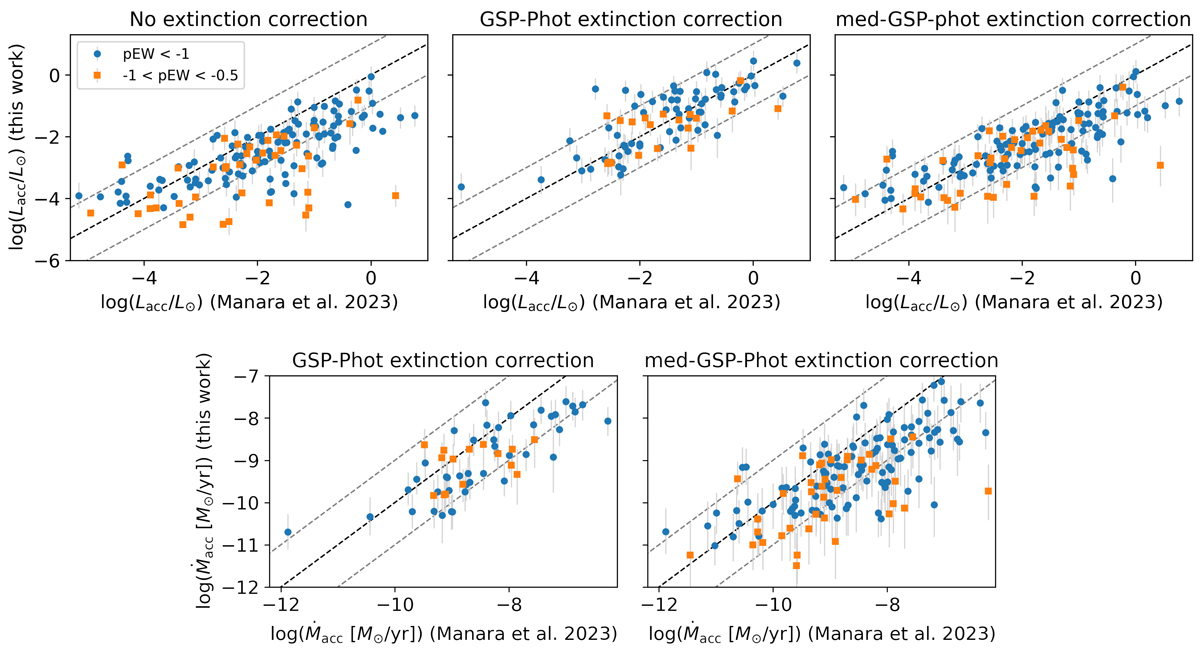
Comparison of the accretion luminosities and mass accretion rates of this work with the values reported in Manara et al. (2023) from higher-resolution spectroscopy. The dashed black lines are the 1:1 lines, and the dashed grey lines show ±1 dex. Top panels: Three plots showing accretion luminosities calculated without accounting for extinction (left), using Gaia GSP-Phot extinction (central), and using med-GSP-Phot extinction (right). Bottom panels: Two plots showing mass accretion rates calculated using Gaia GSP-Phot extinction (left), and using med-GSP-Phot extinction (right).
Current usage metrics show cumulative count of Article Views (full-text article views including HTML views, PDF and ePub downloads, according to the available data) and Abstracts Views on Vision4Press platform.
Data correspond to usage on the plateform after 2015. The current usage metrics is available 48-96 hours after online publication and is updated daily on week days.
Initial download of the metrics may take a while.