Open Access
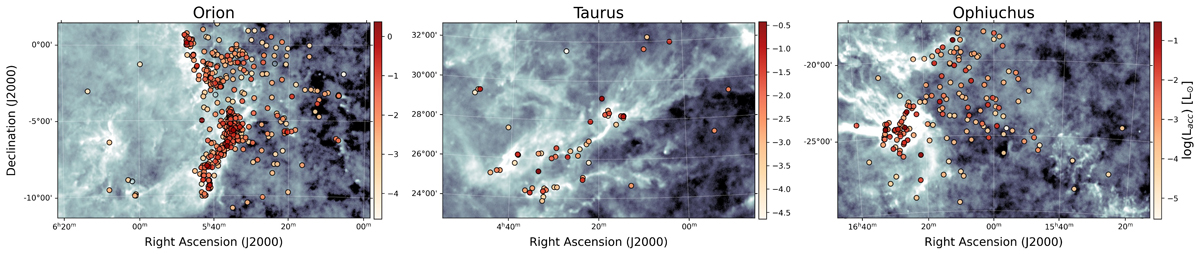
Fig. 8.
Download original image
Detail of some star-forming regions from Fig. 6 bottom panel (sample C), plotted over the Planck map at 217 GHz (Planck Collaboration III 2020). YSOs with higher accretion luminosities can be appreciated concentrated in the more clustered areas, following the structure of the regions.
Current usage metrics show cumulative count of Article Views (full-text article views including HTML views, PDF and ePub downloads, according to the available data) and Abstracts Views on Vision4Press platform.
Data correspond to usage on the plateform after 2015. The current usage metrics is available 48-96 hours after online publication and is updated daily on week days.
Initial download of the metrics may take a while.