Fig. 6.
Download original image
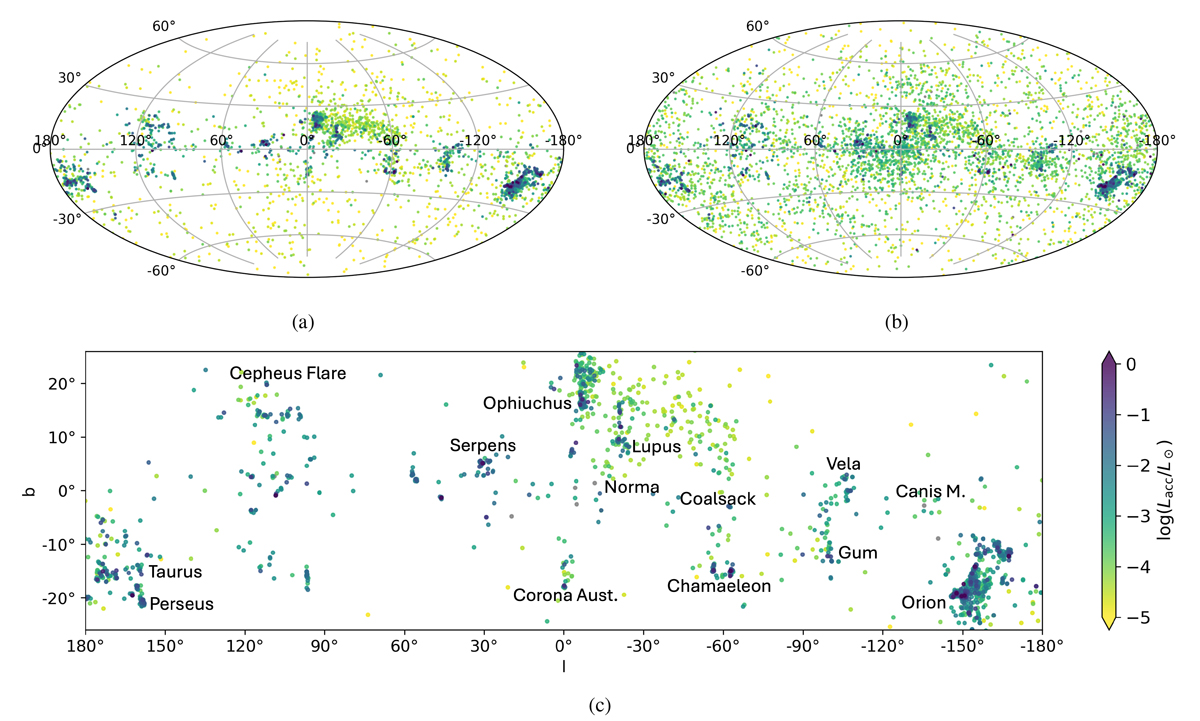
Fig. (a): Sky plot in galactic co-ordinates of YSO H emitters selected using criterion A (filtering by IR excess, Sect. 2.7). Fig. (b): Sky plot in galactic co-ordinates of YSO H emitters selected using criterion B (filtering by pEW). Fig. (c): Sky plot in galactic co-ordinates of YSO H emitters selected using criterion C, which is the intersection of sources in A and B. In Fig. (c), the plot is zoomed in around the Galactic plane. The star-forming regions are labelled following Avedisova (2002). The sources are colour-coded by their accretion luminosity calculated using med-GSP-Phot extinction (Sect. 2.4). The few sources without med-GSP-Phot extinction are shown in grey.
Current usage metrics show cumulative count of Article Views (full-text article views including HTML views, PDF and ePub downloads, according to the available data) and Abstracts Views on Vision4Press platform.
Data correspond to usage on the plateform after 2015. The current usage metrics is available 48-96 hours after online publication and is updated daily on week days.
Initial download of the metrics may take a while.