Fig. 5.
Download original image
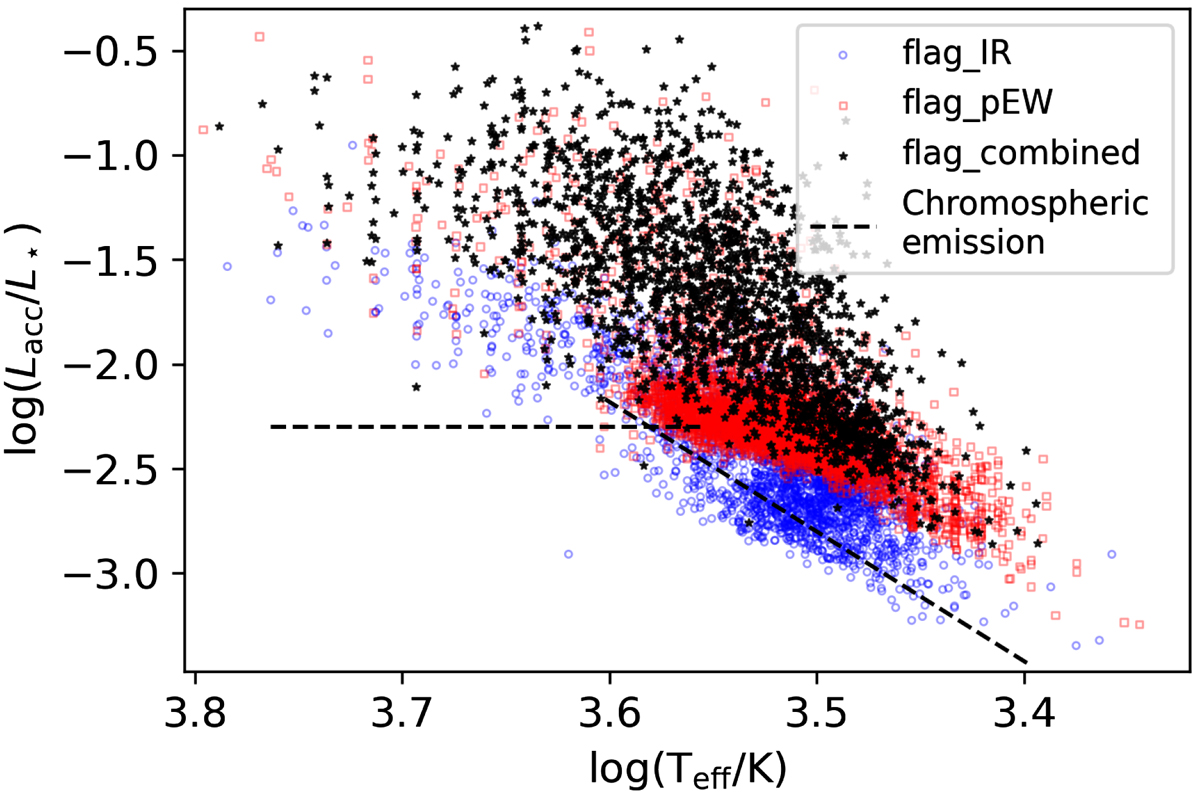
Accretion luminosity divided by stellar luminosity as a function of effective temperature for the all-sky YSOs with accretion luminosity and effective temperature calculated from med-GSP-Phot extinction, from samples A (flag_IR, 4086 sources), B (flag_pEW, 5934 sources), and C (flag_combined, 1871 sources). All sources from sample C are, by definition, also included in sample A and B. Dashed lines trace the locus of chromospheric emission lines when they are erroneously converted into accretion luminosities, as derived in Manara et al. (2017a). 8.44% of sample A and 0.15% of sample B are below the chromospheric emission lines.
Current usage metrics show cumulative count of Article Views (full-text article views including HTML views, PDF and ePub downloads, according to the available data) and Abstracts Views on Vision4Press platform.
Data correspond to usage on the plateform after 2015. The current usage metrics is available 48-96 hours after online publication and is updated daily on week days.
Initial download of the metrics may take a while.