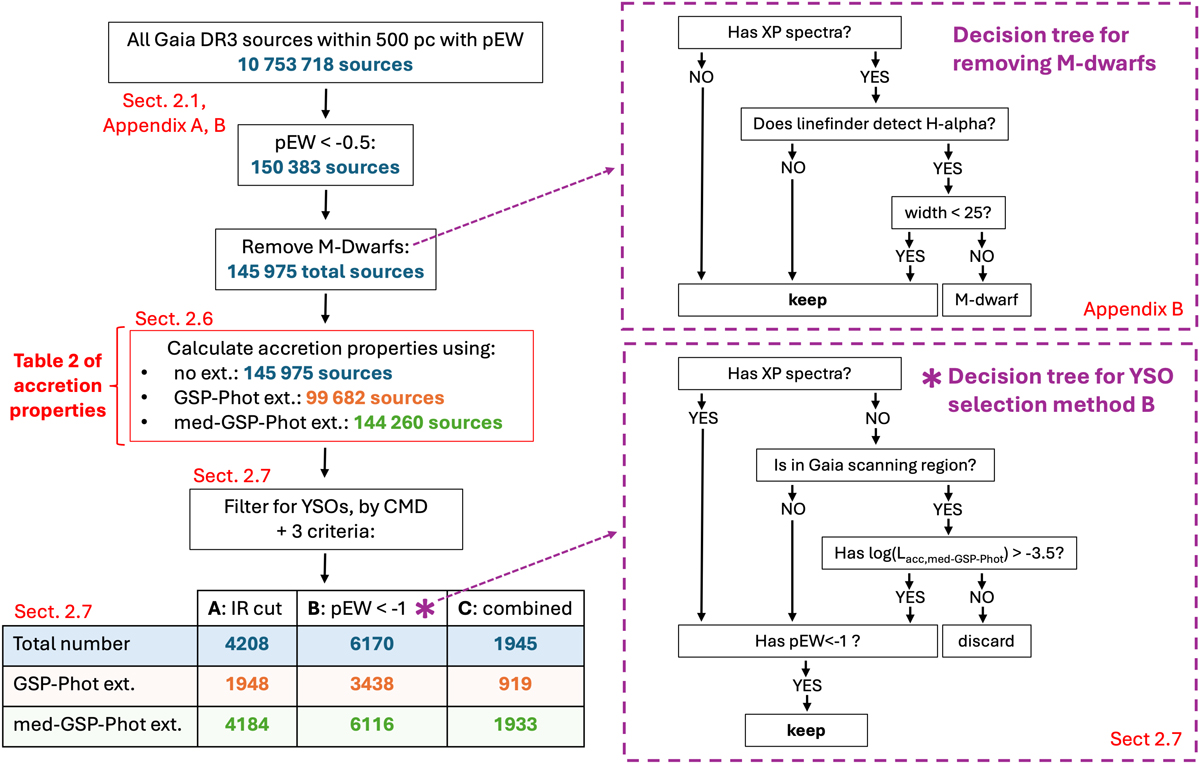
Fig. 2.
Download original image
Diagram illustrating the various selections applied to the original sample of all Gaia DR3 sources within 500 pc with measured pEW to obtain the final sample of YSO candidates (Table 2), and the different quality flags that can be applied to further refine the purity of the sample. The two boxes on the right show two of the steps in more detail.
Current usage metrics show cumulative count of Article Views (full-text article views including HTML views, PDF and ePub downloads, according to the available data) and Abstracts Views on Vision4Press platform.
Data correspond to usage on the plateform after 2015. The current usage metrics is available 48-96 hours after online publication and is updated daily on week days.
Initial download of the metrics may take a while.