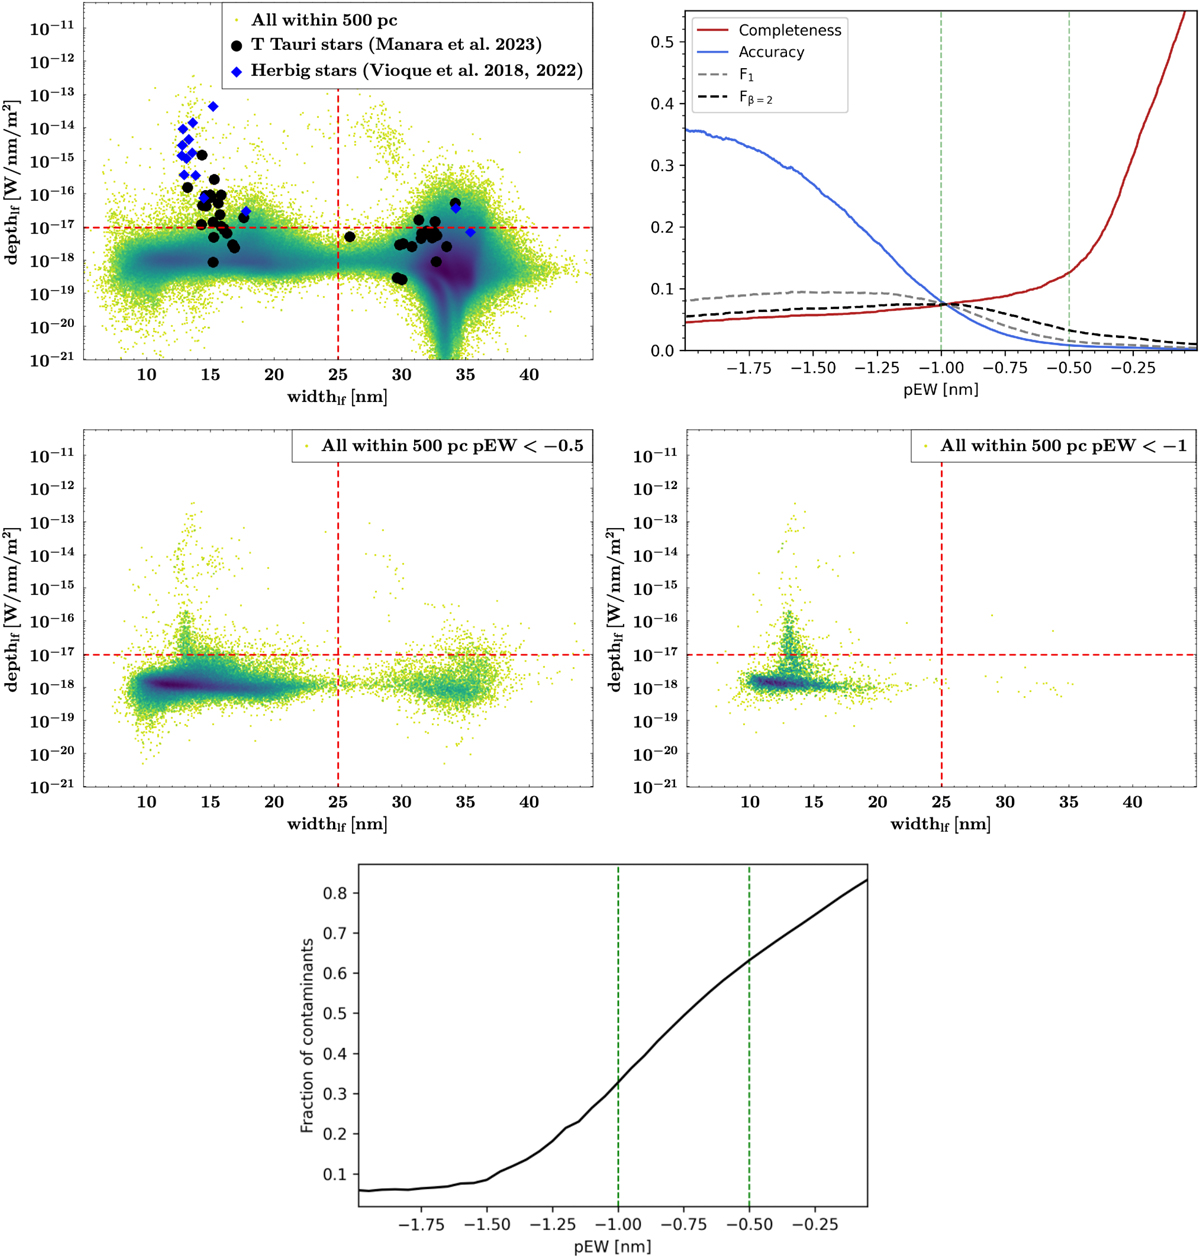
Fig. B.1.
Download original image
Top left: Density plot of the H line-depth against line-width as identified by linefinder for all sources within 500 pc with Gaia DR3 XP spectra available. Dashed red lines indicate the thresholds in line-width and line-depth used to filter non-real H emitters (see Appendix B). Sources with widthlf > 25 nm are mostly M-dwarf contaminants. Sources with depthlf < 10−17 W/nm/m2 have emission comparable to the linefinder uncertainties. Top right: ‘accuracy’, ‘completeness’, ‘F1-score’, and ‘Fβ-score’ metrics as a function of pEW threshold for selecting H emitters. Vertical lines indicate the main thresholds used in this work (pEW < − 0.5, and < − 1.0 nm). Middle panels: Density plots of the H line-depth against line-width as identified by linefinder for all sources within 500 pc with Gaia DR3 XP spectra available and pEW < − 0.5 nm (left) or pEW < − 1.0 nm (right). Bottom panel: Plot of the fraction of contaminants against pEW threshold applied, where the number of contaminants is defined as the number of sources with with widthlf > 25 nm.
Current usage metrics show cumulative count of Article Views (full-text article views including HTML views, PDF and ePub downloads, according to the available data) and Abstracts Views on Vision4Press platform.
Data correspond to usage on the plateform after 2015. The current usage metrics is available 48-96 hours after online publication and is updated daily on week days.
Initial download of the metrics may take a while.