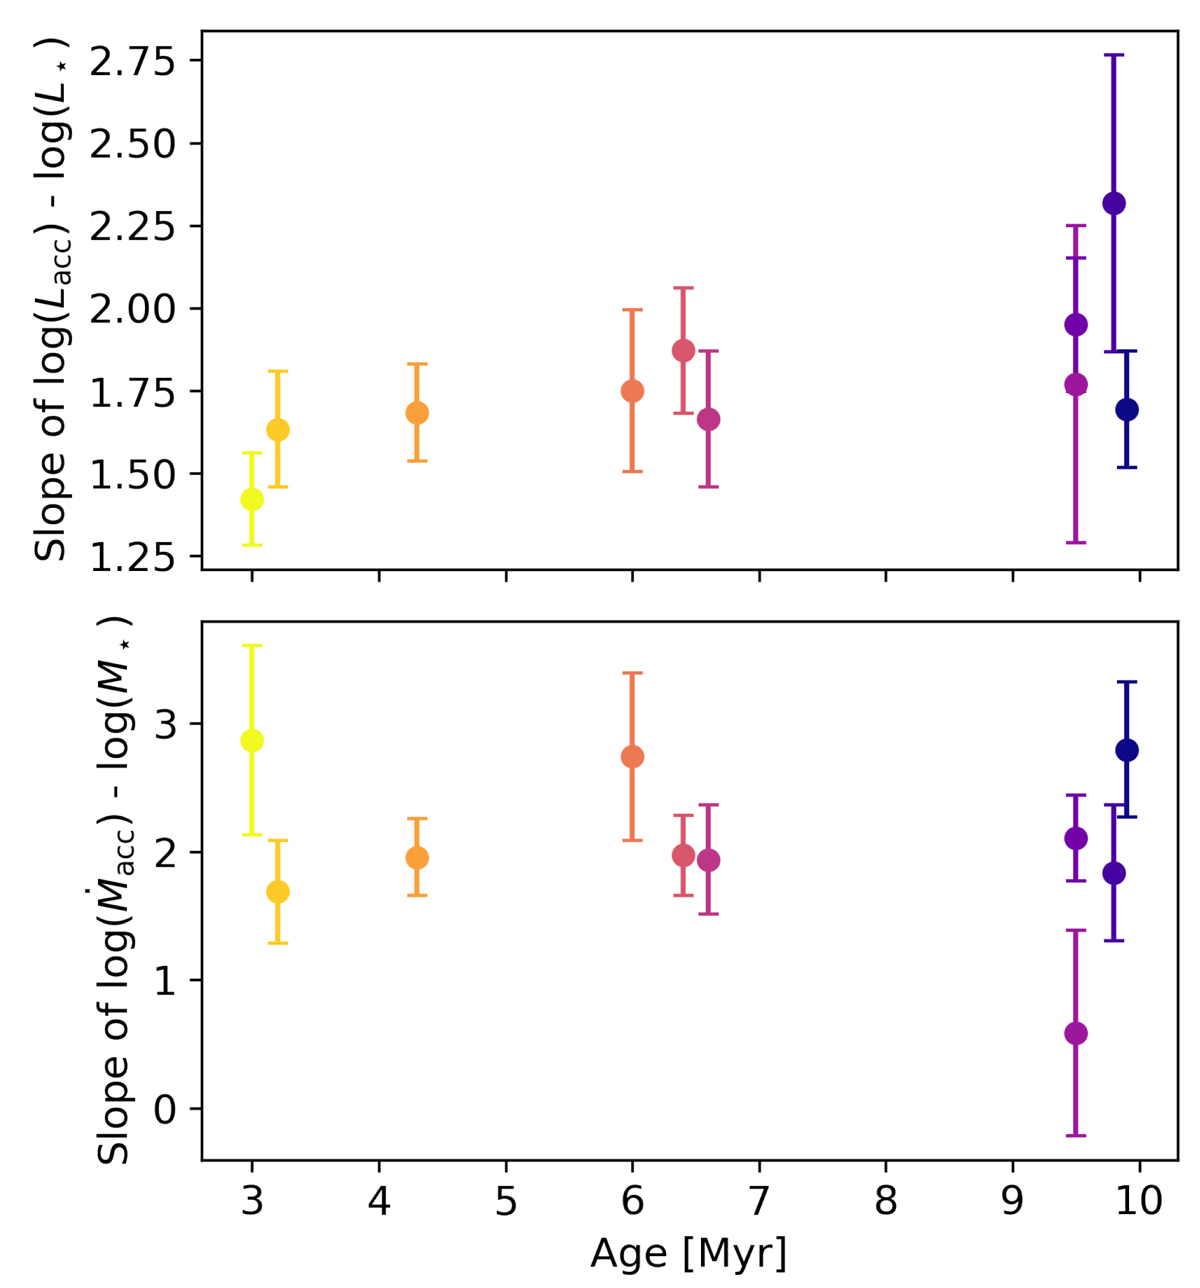
Fig. 15.
Download original image
Slope of the correlations of accretion luminosity vs. stellar luminosity (top panel), and mass accretion rate vs. stellar mass (bottom panel) for ten clusters of Sco-Cen, plotted against cluster age (Baraffe et al. 2015 Bp-Rp ages). For each cluster, we measured the slope of the correlations in the logarithmic plane, using values calculated with med-GSP-Phot, and only considering sources with pEW < − 1.0 nm. Only clusters where at least 20 sources could be used in the fit were considered. Each point is colour-coded to match the corresponding fit in Appendix F.
Current usage metrics show cumulative count of Article Views (full-text article views including HTML views, PDF and ePub downloads, according to the available data) and Abstracts Views on Vision4Press platform.
Data correspond to usage on the plateform after 2015. The current usage metrics is available 48-96 hours after online publication and is updated daily on week days.
Initial download of the metrics may take a while.