Fig. 14.
Download original image
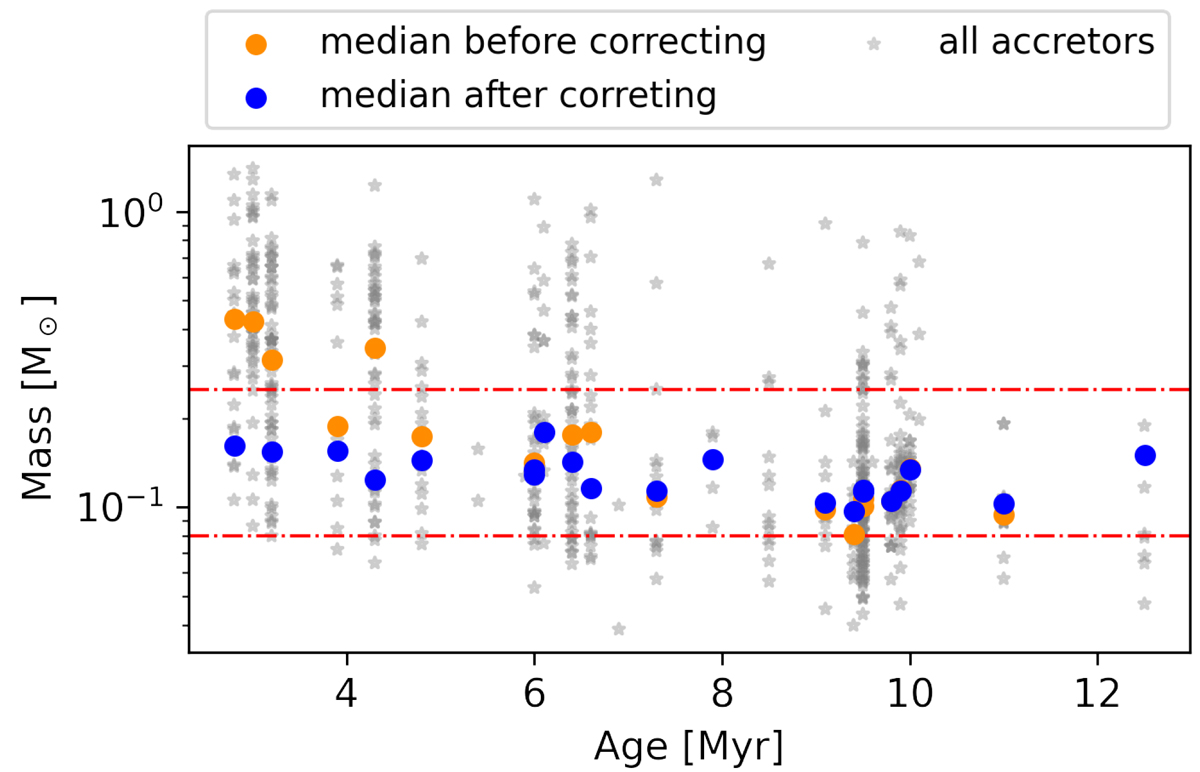
Stellar mass distribution of accretors in the Sco-Cen clusters vs. cluster age (Baraffe et al. 2015-BpRp). The plot shows the stellar masses of all cluster members with pEW < − 1.0 nm as derived in Sect. 2.5 (Table 2), and the cluster median both before (orange) and after (blue) applying the 0.06 < M⋆ < 0.22 M⊙ cut (red lines). The median mass is only shown if there are at least four cluster members in the chosen mass range. We note this filtering by stellar mass results in similar median stellar masses for all clusters.
Current usage metrics show cumulative count of Article Views (full-text article views including HTML views, PDF and ePub downloads, according to the available data) and Abstracts Views on Vision4Press platform.
Data correspond to usage on the plateform after 2015. The current usage metrics is available 48-96 hours after online publication and is updated daily on week days.
Initial download of the metrics may take a while.