Fig. 11.
Download original image
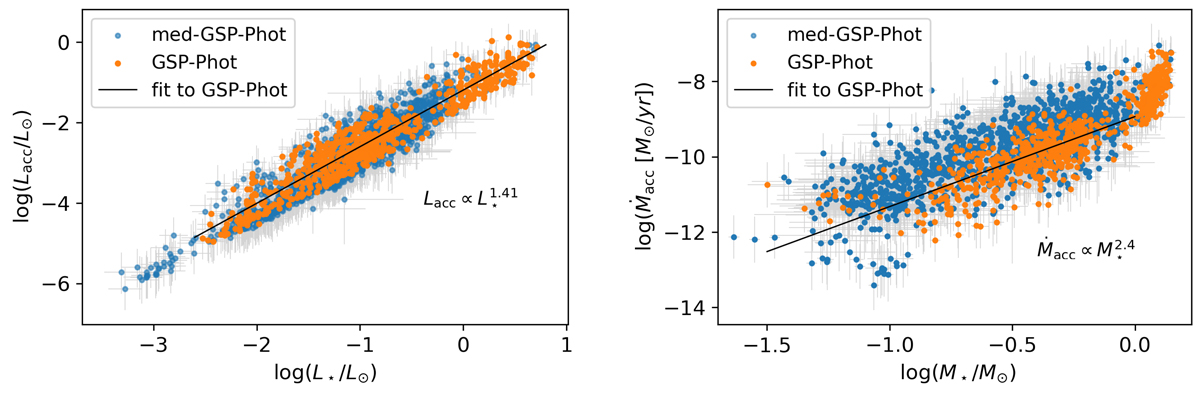
Left: Accretion luminosity vs. stellar luminosity for 1871 YSOs all-sky within 500 pc (sample C, Sect. 2.7). The 655 sources of the sample that have GSP-Phot extinction are plotted according to their values of accretion luminosity and stellar luminosity derived using this extinction. The black line is the fit for the GSP-Phot values of these 656 sources. The value of the slope in the log-log plane is 1.41 ± 0.02. The remaining sources of sample C that do not have GSP-Phot extinction are plotted using the values calculated using med-GSP-Phot. The results of fitting to values calculated with med-GSP-Phot are reported in Table 3. Right: Mass accretion rate vs. stellar mass for the same sample of 1871 YSOs. The 656 sources of the sample that have GSP-Phot extinction are plotted according to their values derived using this extinction. The black line is the fit to the GSP-Phot values, for sources with stellar mass M⋆ < 1.0 M⊙, and with Ṁacc > 10−12 M⊙/yr. The value of the slope in the log-log plane is 2.4 ± 0.1. Again, the sources of sample C that do not have GSP-Phot extinction are plotted using the values calculated using med-GSP-Phot.
Current usage metrics show cumulative count of Article Views (full-text article views including HTML views, PDF and ePub downloads, according to the available data) and Abstracts Views on Vision4Press platform.
Data correspond to usage on the plateform after 2015. The current usage metrics is available 48-96 hours after online publication and is updated daily on week days.
Initial download of the metrics may take a while.