Fig. 10.
Download original image
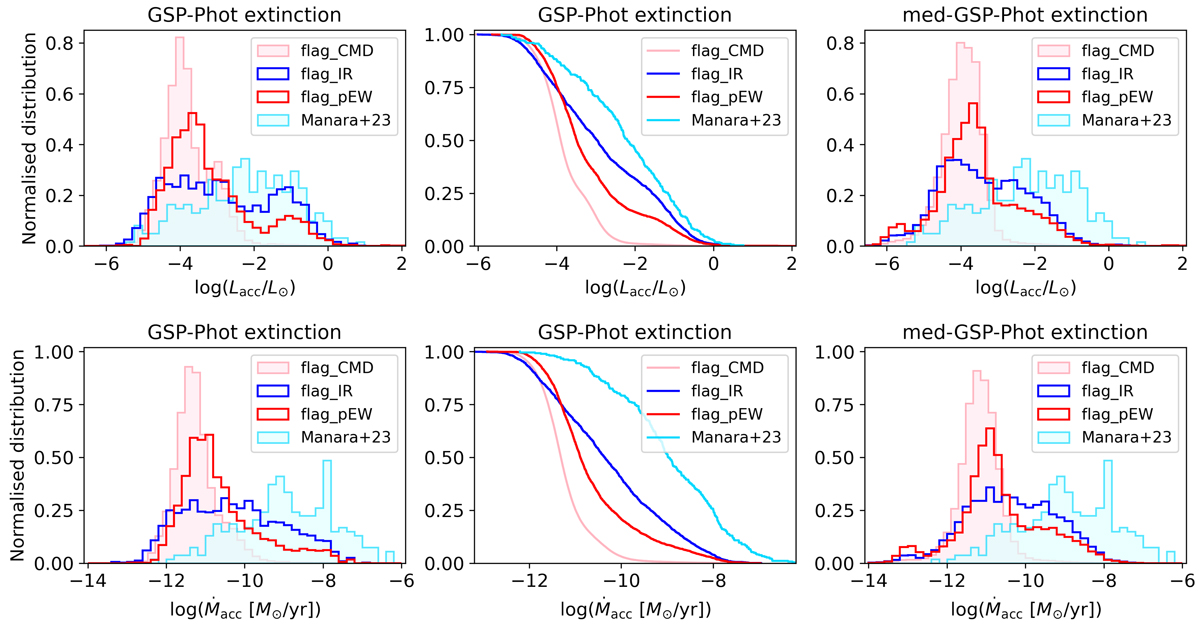
Distribution of accretion luminosities and mass accretion rates derived for YSO H emitters within 500 pc. Different lines trace the quality filters described in Sect. 2.7 (see Fig. 2). The left panels present accretion properties obtained using the GSP-Phot extinction correction and the right panels the ones obtained using the med-GSP-Phot extinction correction (Sect. 2.4). We have added to this plot the accretion luminosities and mass accretion rates presented in Manara et al. (2023) for well-characterised T Tauri stars from higher-resolution spectroscopy. The central panels are cumulative distributions of the accretion properties shown on left panels, using GSP-Phot extinction.
Current usage metrics show cumulative count of Article Views (full-text article views including HTML views, PDF and ePub downloads, according to the available data) and Abstracts Views on Vision4Press platform.
Data correspond to usage on the plateform after 2015. The current usage metrics is available 48-96 hours after online publication and is updated daily on week days.
Initial download of the metrics may take a while.